Charts - Do you make graphs easy to digest?
Loading last updated info...
Graphs are a great way to display data in an easy to follow visual format. Some graphs, however, are easier to read than others. We recommend staying away from 3-D Graphs and keeping it simple! If you have complex data, it's also a good idea to display 2 or 3 simpler graphs rather than one complex one - the aim of the game is to make digesting the information as simple as possible for your audience.
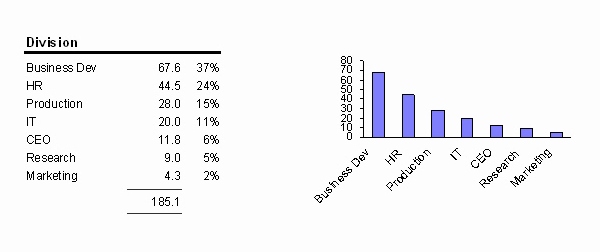
✅ Figure: Good Example - Are your graphs simple to understand?
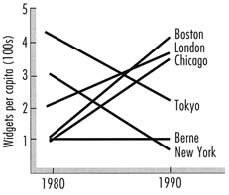
❌ Figure: Bad Example - When there's more than four preceptual units, a graph becomes hard to digest
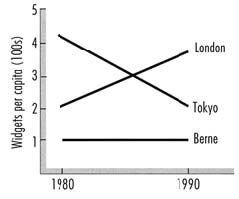
✅ Figure: Good Example - You can split your graphs to make them easer to understand