Do you know how to set up Application Insights?
Loading last updated info...
The easiest way to get started with Application Insights is to follow the documentation on Microsoft Learn.
Lets take a look at the overview and our tips to help you get the most out of Application Insights.
An overview of the setup steps
Application Insights requires that you make 2 general modifications to your application:
- On the client side, manually add a Javascript tracker to your web page header (i.e. by placing directly on each page or through a "master page" or "layout template"), this modification enables the "browser page loading time" monitor and can track client-side exceptions:
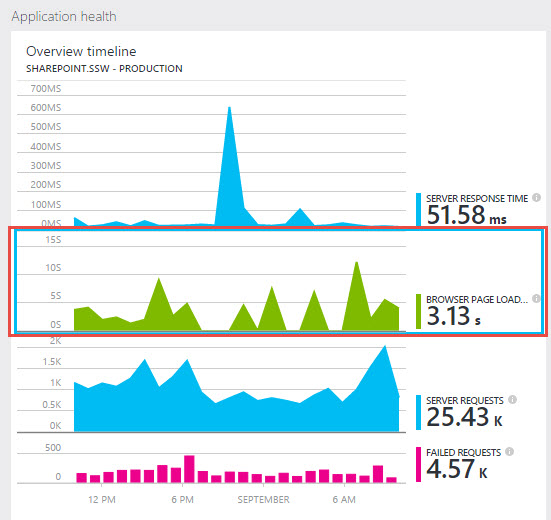
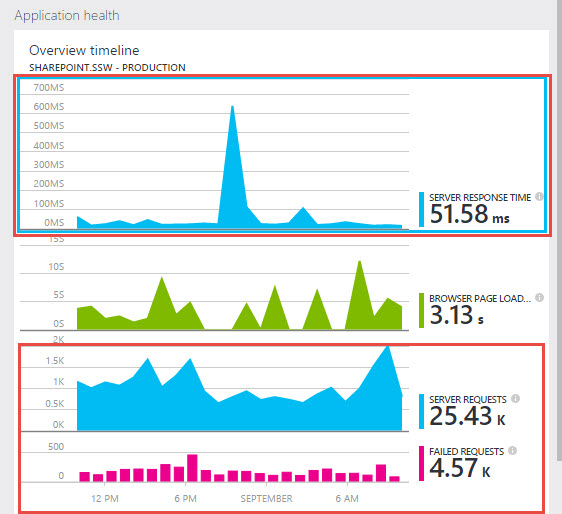
- On the server side, install and configure the Azure.Monitor.OpenTelemetry.AspNetCore package. These modifications enable the "server response time", "server request" and "failed requests" monitors.
Tips
Now that you've added Application Insights, what can you do with it?
Add Health Checks
Application Insights makes it easy to check the health of your app and its infrastructure - see Do you Health Check your infrastructure?
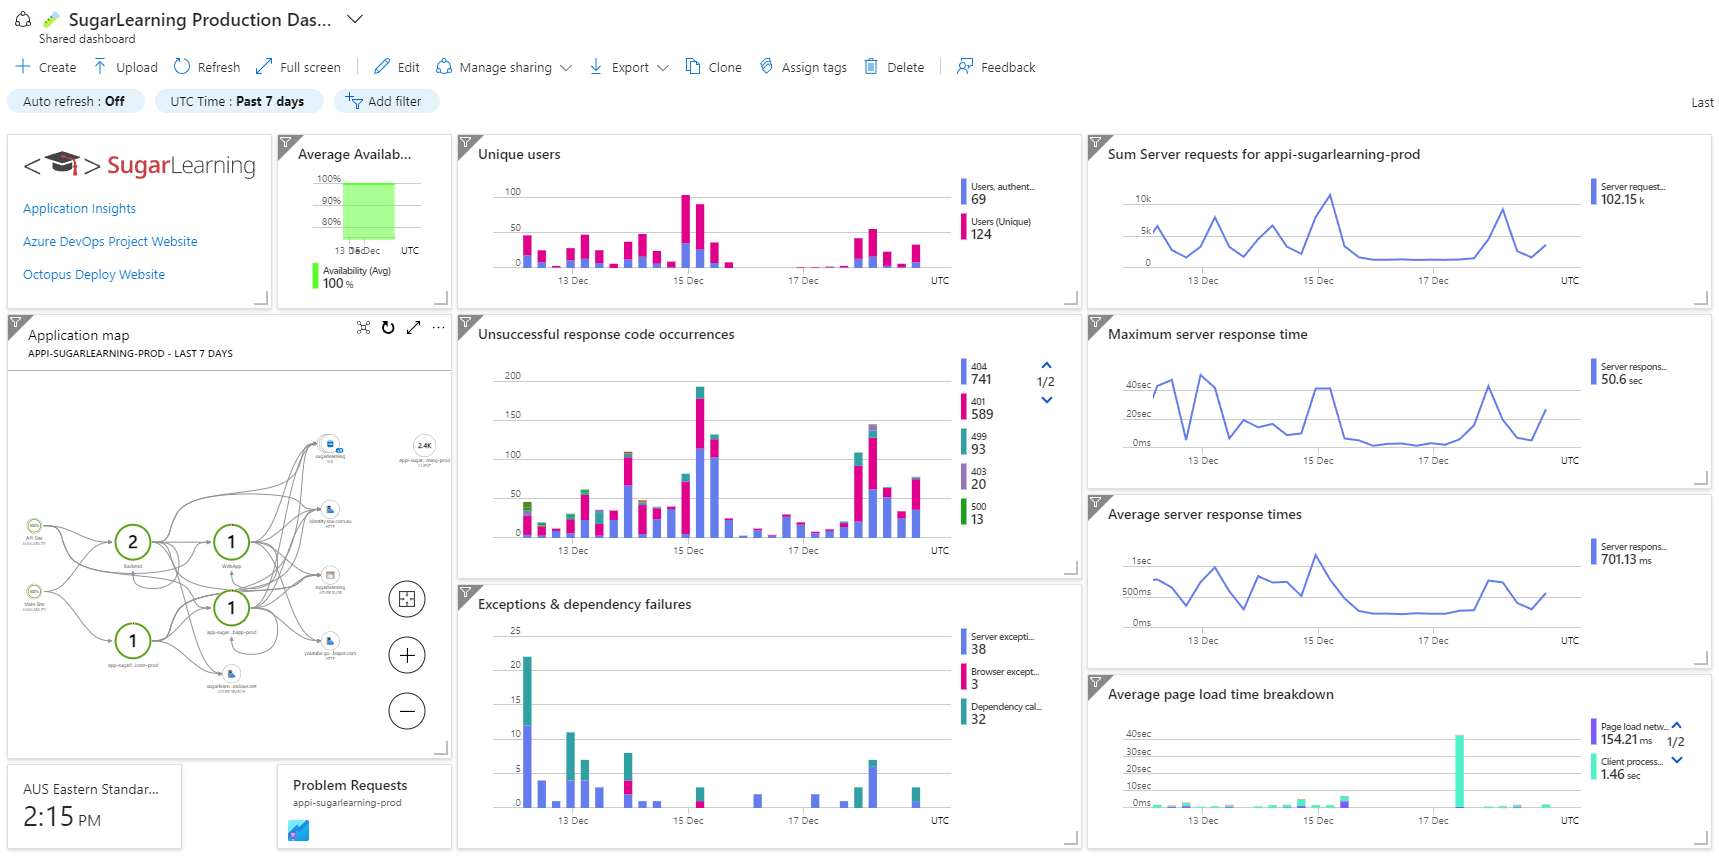
Create a custom dashboard
A custom Application Insights dashboard makes monitoring your application much easier. The KPIs that you would typically monitor for each component of your application are:
- How many requests each component is receiving.
- How long requests are taking.
- How many exceptions and dependency failures are being experienced by the app.
When designing your custom dashboard:
- Size charts based on their importance.
- Lay charts out so that it is easy to compare points in time between charts.
- Ensure that metrics with different scales are not on the same chart. For instance, the average server response time may vary between 250 and 500 milliseconds, but that variance may not be easily visible if the maximum server response time is plotted as taking 40 seconds on the same chart.