Do you have a dashboard that shows what your scheduled tasks are doing?
Loading last updated info...
Imagine a background tasks dashboard that reports a 96.9% success rate and an average run time of 36 seconds. Meanwhile, customers wait more than 20 minutes for their orders to sync. Totals hide which tasks wait, which fail, and whether an expected run starts at all.
For applications with scheduled or queued work, show run timelines, queue waits, failures by task and the last successful run. Give the person investigating a delay enough detail to find the affected task and decide what to change.
Show when tasks run and when they wait
These Northwind illustrations use the same example data: 193 attempts over 24 hours, including 6 failed attempts. One worker handles eight short jobs on the hour. At 02:00, a 20-minute InventoryRefresh runs before those jobs.
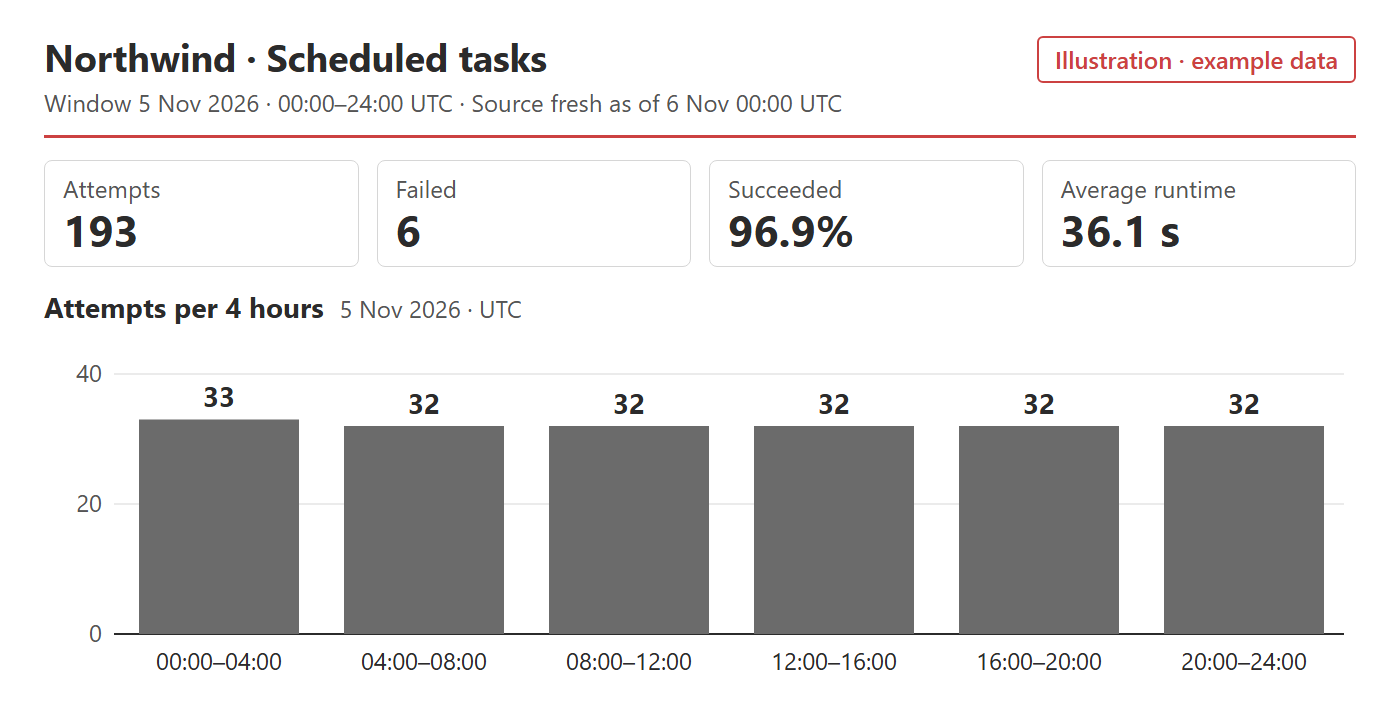
❌ Figure: Bad example - Totals show activity, but cannot explain why an order takes more than 20 minutes to sync
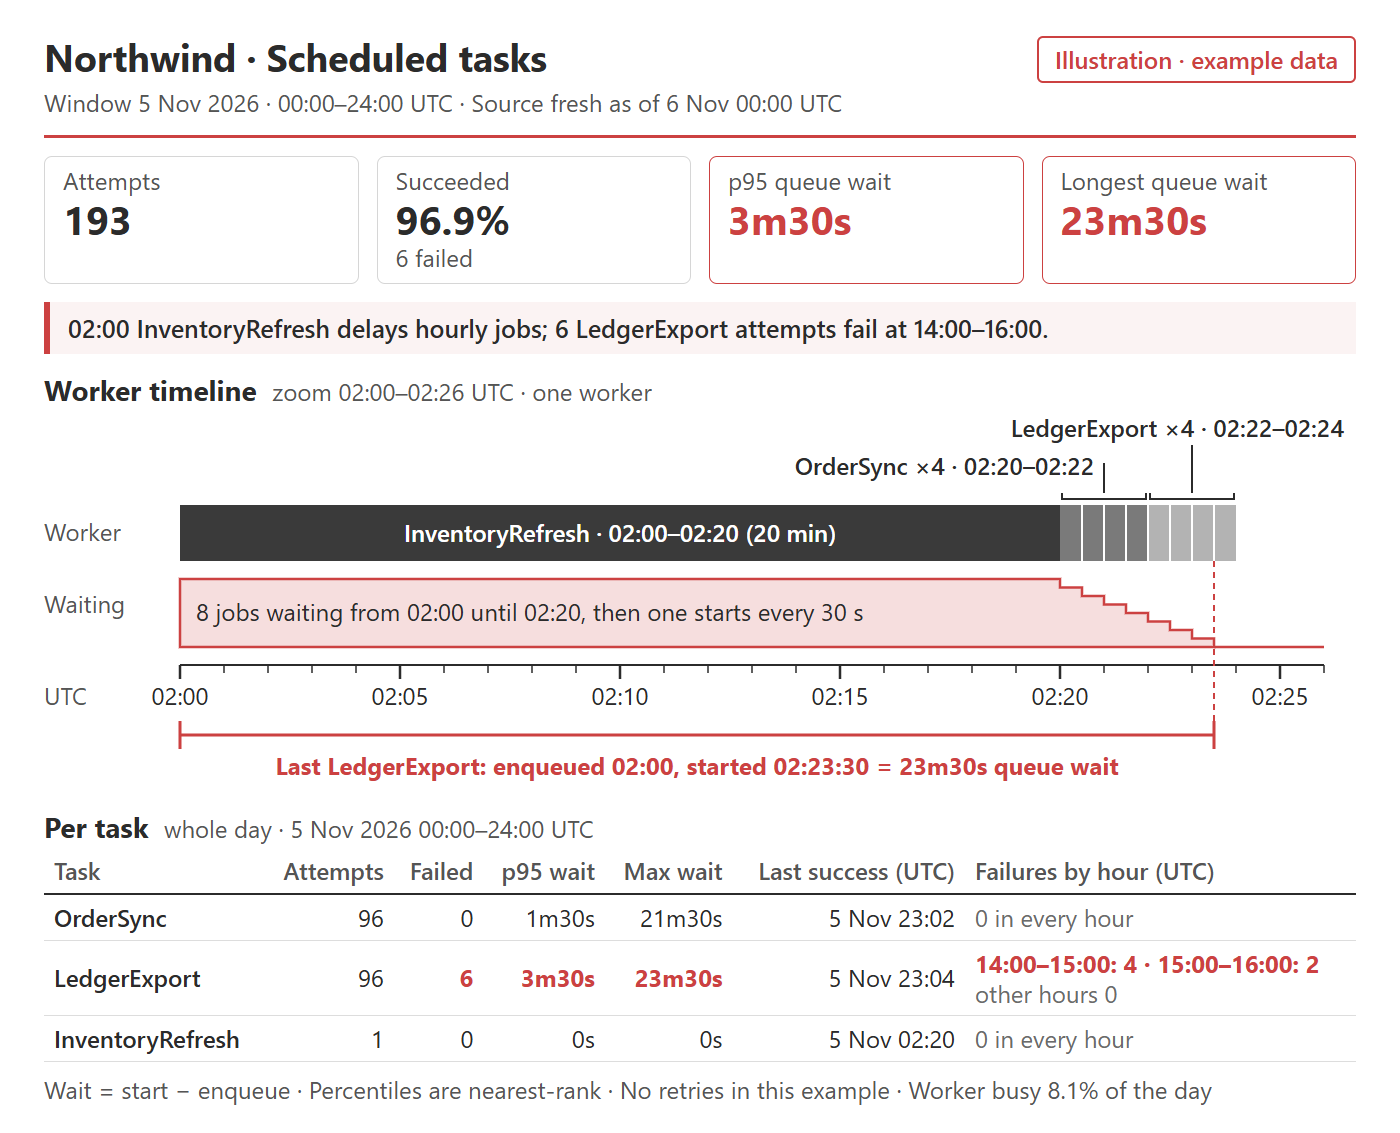
✅ Figure: Good example - The timeline explains the long queue wait, while the task breakdown separates LedgerExport failures from delayed OrderSync runs
Draw each run from start to finish on a time axis, with separate lanes for workers or overlapping runs. Label tasks and outcomes so colour is not the only clue. Keep the time scale linear, or explicitly mark any compressed idle periods.
Show queue depth and the age of the oldest waiting item alongside completed runs. Queue wait = started time minus enqueued time; run time starts only when processing begins. For timer jobs, also show lateness against the expected schedule: a job can start late without entering a queue.
The example worker is only 8.1% busy over the day, yet the last LedgerExport in the 02:00 burst waits 23 minutes 30 seconds. Low average utilisation does not rule out a burst or a long task blocking short ones.
Separate failed attempts from failed jobs
Break failures down by task and hour. In the example, LedgerExport accounts for all six failures: four between 14:00 and 15:00 UTC, and two in the next hour. A total alone hides that concentration.
Add a per-task table with attempt count, failed attempts, p50/p95 run time, p95/max queue wait, last start and last success. The p50 is the median; the p95 helps expose slow attempts that an average hides. Keep the maximum and live oldest-item age visible because a percentile can still hide a small number of very long waits.
Count retries as separate attempts, linked to the original job. Show jobs that exhaust retries separately: a job with a failed attempt may succeed on a later attempt. For example, Hangfire retries failed jobs automatically, so its final job status is not an attempt failure count.
Capture lifecycle data and current state
Use the scheduler's history and queue state where available. Otherwise, record structured events for enqueue, start and finish, with a job ID, attempt ID, task, queue, timestamps and outcome. Deduplicate repeated events by event ID and correlate each attempt with its job. Follow the structured logging guidance for queryable fields.
Completion events alone cannot reveal jobs that are still queued, stuck or never scheduled. Reconcile events with current scheduler state, including cancellation and removal. Track expected runs and last success so a missing overnight run becomes visible; Prometheus's batch-job guidance explains why last success matters.
- Keep time comparable - Store timestamps in UTC, synchronise clocks and label the display timezone. Flag inconsistent timestamps rather than turning a negative wait into zero.
- Make coverage visible - Show data freshness and collection gaps. Use unsampled scheduler records or dedicated lifecycle events for exact counts; sampled traces are useful for diagnosis. Check the export pipeline: Azure Monitor can also sample trace-linked logs.
- Limit disclosure - Use allowlisted task names and exception types. Exclude payloads, arguments, exception messages and personal identifiers; restrict dashboard access and retention. Keep job IDs in protected records, rather than metric labels.
- Protect the work - Keep telemetry bounded and prevent exporter failures from failing the job. Expose dropped-event counts so telemetry failure produces a visible gap.
Use the dashboard to choose and verify a fix
For a burst, consider spreading start times. For long tasks blocking urgent work, consider a separate queue with dedicated worker capacity. A queue name alone does not isolate resources; Hangfire's queue configuration shows how servers select queues. Check ordering requirements and downstream capacity before changing concurrency. Before retrying work, check that repeating it cannot duplicate side effects, such as sending an invoice twice.
Choose an acceptable wait and completion deadline with the task owner. Alert when the oldest queued item exceeds that wait or an expected run misses its success deadline, with a link to the affected task and its owner. A dashboard supports investigation; alerts bring unattended failures to someone who can act.
Before relying on it, use a safe fixture to enqueue delayed work, fail an attempt, retry it, miss an expected run and interrupt telemetry. Confirm that the timeline, counts and alerts agree with scheduler state. After a scheduling change, compare equivalent periods: waits should fall without increasing failures or violating task ordering.