Every day there are little things that we find annoying with the
programs we use. Sometimes we just can't quite do what we want or
there may just be room for improvement. We could write books about it,
like Annoyances.org, but we thought this would be more constructive.
Here is what we would like Microsoft to change within SQL Server
Reporting Services.
-
ASP.NET 2 master page style report templates
We, like most of you, use letterheads and standard document
templates to ensure that every document that leaves the company is
the same. So why should this be any different with your reports?
Reporting Services does not have this functionality, which causes
a few big problems:
-
You have to copy and paste your company logo into every single
header of your existing and new reTest data source connection
-
The subscription needs an extra Name field
Microsoft SQL Reporting Services suggests all this into every
report, it is hard to make sure that everything is consistently
aligned and sized for all reports; the designer is very flexible so
it is easy to get this wrong.
Figure: Reports should copy the concept of ASP.NET 2.0 master
pages so that you can have a template master that all reports use
-
Report output CSS for specific report format
With web pages you define multiple .css to define styles for
different output devices. E.g. Screen.css, Print.css and
Mobile.css. So when someone prints the page it will say use a much
smaller font.
Is there a way this can happen in Reporting Services reports
– like when they choose to export to Pdf it formats with a
smaller font. Eg. Screen.css, Pdf.css, Excel.css, Mobile.css.
-
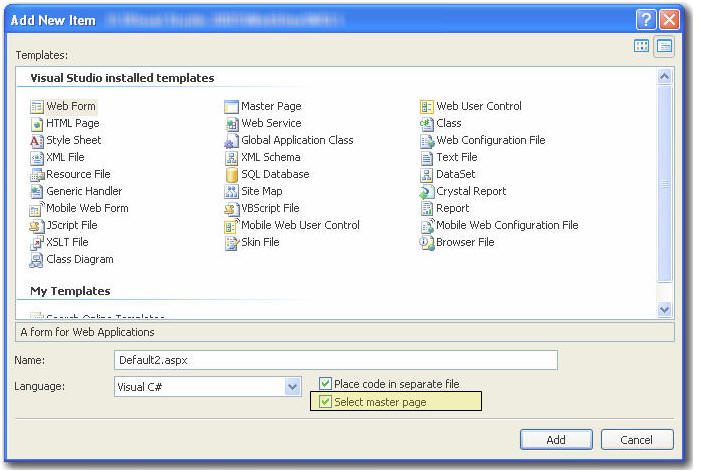
Add option to inherit a template (aka Master Page)
Like Master Pages in .NET 2.0, reports should be able to inherit
from a master report. When a report is added inheriting a Master
Report, it can automatically have standard header & footer.
-
-
Figure: When adding a new item in VS.NET 2005, you may choose a
master page to inherit from
-
Browser Integration for Editing Reports
Although perhaps rather difficult, when viewing a report from
ReportManager I want to be able to click a button (preferably like
the one in IE for editing pages using FrontPage) and the Report
Definition File is automatically downloaded and then opened in
Visual Studio (providing the RS client is installed).
This is already possible for editing pages directly in Frontpage
via a button in the web browser. To see how to set this up, see
our
rule on Rules to Better Websites - Development
.
-
-
Figure: Quickly editing a webpage using the browser integration
for Frontpage. Can SQL Reporting Services developers be offered
the same functionality?
In this way all employees (with sufficient privilege) can
conveniently make changes to the report when needed. To see why we
think users will be able to efficiently change web documents see
our
rules to better websites
A possible solution would be to have the report server append a
meta tag to the output html source. A browser plugin would then
detect the meta tag and allow editing of the appropriate report.
-
Query Strings
When a report is viewed either directly from the ReportServer or
via the ReportManager the querystring for the report including the
parameter values will automatically be updated after the "Preview
Report" button has been pressed.
In this way, a report with the given parameters can be easily
bookmarked or passed on using only the address in the address bar.
-
-
Figure: This report has an incomplete query string - when you
view a report the query string should automatically get
re-generated
For example, since I have used non-default parameter values, the
query string will read:
http://localhost/reportserver?%2fSSW+Exchange+Reporter%2fEmailSentItemByDate&rs:Command=Render
&DateStart=1/1/2004&DateEnd=31/1/2004
This could be an option for either the report (specified at design
time) or for the entire report server (specified at install time /
via server config files) so that they can be turned on or off (for
those with issues with privacy). See why we think query strings
are important on our
rules to better websites
It is true that if there are a large number of parameters the
query string method may not work. All software has limitations -
just put a warning messagebox when you turn it on.
-
Syntax Checker for Expression fields
-
* Fixed by Microsoft in Reporting Services 2005 *
After entering an expression into a field there should be a button
to verify the syntax within that expression. At the moment you
have to run the page to see the error. It is such a pain.
Figure below shows the expression box. Please add a button "Check
Syntax".
-
The Task List should be more interactive, add filtering and auto
shortcuts
When you use the task list to manage your SQL Reporting Services
issues (such as those generated during the import from Access) we
would like to be able to:
-
click each warning and have it take us to the place in the
report design (or at least open the relevant report).
-
As issues are resolved they are automatically removed from the
task list
-
Filter on the current file only, so that we can see only the
warnings for the report that we're working on. (If turned on).
This is the same functionality provided for coding in Visual
Studio, but doesn't work here.
-
Please add a variable Global!ExecutionTimeTaken
-
* Fixed by Microsoft in Reporting Services 2005 *
NOTE:
You can do this using an expression. See our
rule on Rules to Better Reporting Services
.
We need an easy way to see how long a report takes to execute.
Often when you add controls and grouping to a complicated page you
want a way to test the performance impact of these changes.
-
-
Figure: It is useful to show the execution time along with other
information at the bottom of your report
-
Intellisense for Expression fields
-
* Fixed by Microsoft in Reporting Services 2005 *
Use Intellisense inside expression fields to pre-empt what operation
we want to perform. Because there is still a huge number of methods
available other than what's in the pre-defined expressions panel
this would be convenient. For example using controls inside another
namespace such as System.String or a custom code function denoted
with the Code.<Function> operations.
-
Report Parameter Control - Date Pickers and Auto buttons
There is no control over the parameter input bar on the reports
viewed through the browser other than type validation and drop down
lists. We would like to see more customisation of these controls,
such as:
- Next Month / Quarter / Year
- Previous Month / Quarter / Year
We like
Peter Blum's
 date picker control.
-
-
]Figure: We would like to see better date navigation controls
(like these) in Reporting Services
Besides, it would be great to have a DateRangePicker control.
Instead of picking the start date and end date in two separate
controls, we can pick the start date and end date easily in the same
control.
-
- Figure: DateRangePicker
We would also like to have such controls in
ASP.NET
 .
.
-
The initial release of Reporting Services 2005 comes with a
"Select All" option for multi-valued parameter lists. With SP1
this has been removed because, according to Microsoft, "the
option affects performance when used with a multidimensional
data source". That's all well and good, but what if my parameter
list only has 5 or 10 values? The solution is to give the user
an option (in the form of a checkbox in the parameter
properties) to include a "Select All" option. There is a
workaround
which involves modifying your SQL query, but this is quite
tedious.
UPDATE: This was fixed by Microsoft in Reporting Services 2005
Service Pack 2 as per Brian Welcker's blog:
http://blogs.msdn.com/bwelcker/archive/2006/08/14/700189.aspx
-
-
Figure: Microsoft added and then removed the "Select All" option
from multi-valued parameter lists, but we think it's more
flexible to be given the option to show/hide this property
-
I believe that programs that have a lot of components should
have a diagnostics system. (e.g. Start | SQL Server 2000 |
Reporting Services | Diagnostics). For example, it should at
least check that the page and system is working rather than
giving a security error when you actually attempt to run a page.
For example, we installed a Yukon Beta, with a Whidbey Beta, and
the IIS settings were reconfigured but there was no indication
of a problem except by running an actual report. But having
fixed that problem, we cant be sure that it wont break on some
other functionality - a diagnostics system would tell us nothing
is wrong.
In our products (for example
SSW Code Auditor
) we implement a "Run Unit Tests" item on the help menu that will
open NUnit and run a number of tests to verify the configuration
settings are functioning.
-
User Interface: Please give me a visual indication of which tabs
are not on their defaults
For example, I should be able to see that Sorting has something in
it before I get to it I would suggest a different colour background
on the tab or even a little asterisk or marker to suggest fields of
interest. As per David Leans' suggestion, this would best be done
with the tab label being put in
bold
.
-
-
Figure 6. A value has been entered on the sorting tab so there
should be some indication
This way editing a report that someone else has designed would be
much easier as I could quickly see what fields have non-empty /
non-default properties assigned.
-
User Interface: List control grouping parameters (Inconsistency)
The grouping controls for a table control are nice in that you can
conveniently manage them with a straight forward add, edit, and
delete buttons. But why does the list box control have such a
horrible one?
-
- Figure 7. The good! Grouping on the table control.
whereas for the list box control we need to navigate to a similar
screen through the button.
|

|
|
Figure 8. The bad! Grouping on the list control
|
If this button is necessary, then tie it in with the idea above,
so that you can conveniently see whether groups are defined. Or
this could be done by having the "Edit" button disabled if no
groups exist and an additional button for "New Detail Group".
-
Charting - Flexibility to resize individual chart elements
Charting controls need to be more flexible. You cannot resize
individual elements of the chart control such as the size of the key
or the plot area. These are basic properties that we have in Excel
charts but not in SQL Reporting Services charting components.
-
Charting - Default maximum and minimum scale values for charts
Many of the properties of the charting component do not allow
expressions for their values. Some major examples include dynamic
size (so that we could base it on the number of items), the scale
(so that we can make the max scale for multiple graphs all appear
the same).
The max and min scale properties have been partially fixed in
Reporting Services 2005 - you can now use expressions in the Max
Value and Min Value fields of your charts. See our
rule on Rules to Better Reporting Services
.
I say partially, because you still have to manually set these
values on a chart and it requires a bit of a hack to do (see the
above rule). Why can't a chart automatically work out its maximum
and minimum value based on the grouping level? There should be a
default value, and an option to enter an expression.
-
-
Figure: Reporting Services will work out the maximum and minimum
values for the chart's scale - currently you have to do it
manually
-
Add an Internet Content Control for embedding HTML
Reporting Services is missing the ability to embed web pages into
its reports. For example, say you have some web pages that are
updated regularly (e.g a project page) and you want these pages to
be emailed to you weekly. It would be great to take advantage of
the Reporting Services subscription engine, but we need to be able
to embed HTML pages into RS reports to get this done.
We think that an Internet Content Control will be introduced and
it will have the ability to:
- Set the resulting HTML at the control level
- Set the CSS property
- Set the title property of the HTML page
-
Rich Textbox Control
We need a textbox control that you can format the internal
content. For example we might want to have text display like this:
This is a
bold
label with
italics
in it too.
This would be useful for building reports that are used for
invoicing or contracts that you use all the time but need to be
tailored for a specific contact.
-
Multiple Select in Parameters
-
* Fixed by Microsoft in Reporting Services 2005 *
We need a parameter type that will enable us to have a list of
values (likely from a query) such that you can select multiple
values from the list and then use the set of parameter values in
your dataset queries or report items. For example, we want to
allow our users to report on set of suppliers all at once, rather
than one at a time.
|
|
|
Figure. Add a new datatype - MultipleSelect to allow
selection of multiple parameter values from a list.
|
The resulting control displayed on the parameter bar will be a
checkbox list control.
See why
.
The parameter value would then require restrictions put onto it so
that it can only be used in aggregate or set functions within the
dataset. For example:
SELECT au_lname, state
FROM authors
WHERE state IN ('CA', 'IN', 'MD')
-
Long Running Reports - Delay reporting
If you have a report which is known to run for a long time, an
administrator will be able to select an option for the report so
that the user is notified that the report is going to take a while
to execute, and are forced to have the report returned via email.
The server can then complete processing on a background thread.
-
Select Reports to Import from Access
When you use the "Import Reports" from Access functionality, it
always imports all the reports rather than allowing you to import
just a few.
For example, the import feature within Access allows this. You
should be able to select only the reports you want.
-
-
Figure 10. Importing reports from another Access database within
Access. In SQL Reporting Services you should be able to
selectively import reports also.
-
The Task List is lost on restart of Visual Studio
The task list is a handy feature built into Visual Studio. It
provides a single point of reference for any user tasks,
compile-time warnings and errors found in your reports. In most
cases you can double-click the task to jump to the offending line
of code or control. For some reason Reporting Services does not
retain this list of errors once you close Visual Studio, so you
have to copy and paste the errors into notepad, which can be
annoying. (Note: this works for items manually created.)
When the report is first imported there are comments in the .RDL
file for each warning; however, after any changes to the reports
these disappear. We would like to see this task list retained, so
that the developer can check off tasks in the task list as they
are done.
-
-
Figure: If I close down this solution, all the task list items
related to the import process are lost.
-
Tool tips on column headings
It would be handy to show a descriptive tool tip when you move the
cursor over a column heading. This would be great because the user
could see more information about the data in a column.
Figure: it would be great to have descriptive tooltips like this
when you mouse over a heading
-
Show / hide columns
Sometimes we want to print a report with certain columns shown or
hiding. This would be great for custom reporting without having to
go back to the developers to make the change.
Figure: It would be great to have MS Access-style show/hide
columns
-
Get the XML and SQL behind a report
When I run a report, sometimes the data doesn't look right.
Instead of chasing the developer to investigate, I want to be able
to find out the SQL behind the report and run it myself using SQL
Server Management Studio. I would also like to be able to see the
XML (RDL) behind the report.
-
Embedded Images
If you create a report with an embedded image and then you delete
that image, it remains in the xml report definition, therefore
unnecessarily increasing report size. To get rid of the image, you
need to either:
-
Manually delete <EmbeddedImages></EmbeddedImages>
from xml.
-
Understand that you deleting the image control – there is
a 1:many relationship between embedded images and image controls
(you can reuse images in multiple places on the report). To
delete an embedded image, select “Report” –
“Embedded Images”.
What should happen is - when you delete an image control it asks:
"Would you also like to delete the embedded image?"
Yes / No
If you select Yes it could open this "Embedded Images" form
-
Linked Images that are deployed to a relative path don't show in
Designer
When we use images in our reports we like to make a separate
project to deploy the images to a path relative to the report
location (e.g. ./Images/logo.gif). This process is detailed more
in the
reporting services whitepaper
(under "Tip 3 - Organizing Images" at the end of the paper).
The problem is that during design time, despite the images still
being correctly in the relative path to the .rdl files, they don't
show up in the designer. Understandably the relative path won't
necessarily be correct for the deployed version to work, but if
the path is valid then the image should show.
|
|
|
Figure 11. The path on the images is correct both for
the deployed and non-deployed reports. It should show in
the designer.
|
-
Set the default zoom level
We need to be able to set the default zoom level. For example,
reports should open with the zoom level set to "Page Width" rather
than 100%.
-
Stop/start the Reporting Services service from service manager
Since reporting services is part of SQL Server, we should be able
to control the service from SQL Server Services Manager.
-
Show built-in formatting options for report controls
When you select formatting for text in a textbox or other
Reporting Services report controls, the built in formatting
options should be selectable from the list (such as C for currency
and P for percentage)
Figure: Just like when setting formatting for controls in
Access...
Figure: ...there should be built-in formatting options in the
Format property for a report control
-
Add the ability to dynamically change the title of the report
Say you have a sales report that you generate once a month and
export to a file. You want to build an archive of these reports
for comparison and to keep a history of sales. You also want to
expose this history for searching and browsing through a content
portal such as Plumtree or Microsoft SharePoint. Currently you
cannot do this with Reporting Services, as the report title is
static.
Figure: You cannot change the title in Report Manager, which
makes it hard to index, search and archive reports
Ideally there should be a
Page Title
attribute in the report properties dialog (shown below) which lets
you enter a custom title to display with the report. You should also
be able to enter an expression with parameters into the title, for
example,
{ReportName} - {Month} {Year}
.
Figure: Add a property to this table called
Title Tag
Figure: This is the HTML Title Tag you need to be able to change
These parameters should appear in the report parameters dialog so
that you can link them to fields in your data source.
Figure: You should be able to add report parameters to your
report which can then be used in an expression for the page
title
-
Version Info
Figure: Reporting Services does not have explicit version
information.
This needs:
-
Add icon to denote Required Parameters
As there is the option to allow some parameters to be left blank,
required parameters should have an icon depicting that they are
required. On reports that have many parameters, this makes it
easier for the users to distinguish between required and non
required parameters.
Figure: Blank and Null Parameters are allowed

Figure: But what RS needs is the ability to show a Required
Field Icon like in this example
-
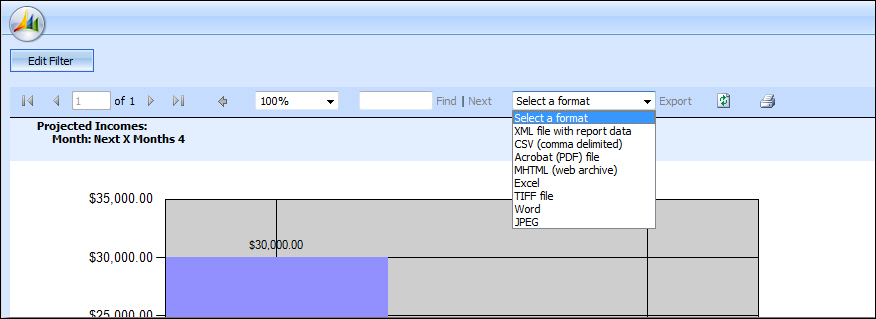
Add MS Word to the Export list
There should be an option in the Export to file list that allows a
user to export to a Word document.
Figure: Current RS Export List
-
Add a Calender View and Gannt Chart Control - Like MS Project
There should be a calendar control (similar to that in MS Project)
that allows a user to drop Calendar related data onto it which is
automatically puts into the right place. There should also be a
Gantt chart control or a Gantt chart type option added to the
existing chart control.
Figure: RS needs the Calendar Control like MS Project
Figure: RS needs the Gantt Control like MS Project
-
Parameters - When you add a Parameter it should automatically add
a label to the designer
Too many developers forget to add their parameters to the design
of a report. Then when the user exports it to say a .pdf, they see
the report, but they dont know the parameters that gave the data
they are looking at.
When a parameter is added to a report, the labels should be
automatically added that display the parameters being used on the
report.
-
Add an AutoPostback property for parameters
Especially when there is only one parameter people dont want to
click View Report.
When a parameter is displayed (especially when using combo boxes
and multi select is not enabled), the report should automatically
refresh upon selecting a new parameter from the combo.
This would make it consistent with the ASP.NET.
-
Add option to select a Linked DataSource
There should be an option Add Linked Data Source; that is, a way
to add Linked Data Sources so that the same Data Sources can be
shared by many different report server projects.
-
A much better Matrix control
There should be a Matrix control that has Pivot Table
interactivity (like Cognos). It should allow for Drag and Drop
functionality and allow the user to drill through automatically.
While drag and drop, and auto-drill through can be seen in the
Reports Builder, a similar control should be implemented for the
Report Developers to use as well.
-
Report builder should default to a home directory
When a user creates a report using the Report Builder, the save
path currently defaults to the Report Server's root directory this
seems to be the only place you would not like users to save
reports to.
Therefore, when saving the ad-hoc reports created by Report
Builder, the save path should default to a directory such as the
Windows Username, Eg. \AdamCogan\Report1
Figure: Saving currently defaults to the Root directory... it
should default to a Username folder instead
-
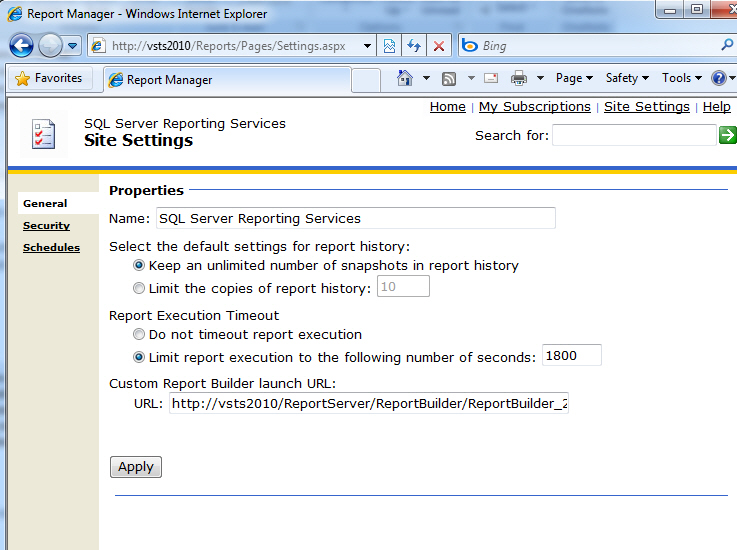
Help me use Report Builder 2
I have Report Builder 2 on my PC but when I click "Report Builder"
it still opens version 1.
Why not automatically set the 'Custom Report Builder launch URL'
field
(to
http://SERVERNAME/ReportServer/ReportBuilder/ReportBuilder_2_0_0_0.application)
when I install the latest SQL Server Service Pack?
PS: It should also happen when you install the stand alone
download
http://www.microsoft.com/downloads/details.aspx?FamilyID=9f783224-9871-4eea-b1d5-f3140a253db6&displaylang=en
PPS: and make that last text box wider.
-
-
Figure: Automatically set the 'Custom Report Builder launch URL'
field so the users are using Report Builder 2 (instead of
version 1)
-
The wizard should accept style templates (aka .css files)
While using the New Report wizard, you should be able to add to
the list of Styles available in order to help to create reports
that are consistent with a company's color scheme.
I suggest adding an "Add Template" button to this wizard page and
allowing you to select an XSL Style Templates or CSS templates
against a report (just like ASP.NET).
Note: At a form level an extra property Template File needs to be
added.
Figure: This page of the wizard needs an Add Templates button to
enable you to select .xsl or .css file.
-
Auto-sizing columns
When you preview your report, sometimes it can take some time,
switching back and forth between layout and preview modes, in
order to get the column widths the right size to allow prevent
your report from looking ugly. For this reason, there should be
some functionality added to help overcome this problem.
A few implementation suggestions are:
-
In design view there could be a smart task on the table/matrix
that executes the data and works out an intelligent width.
-
You could add a multi-line property, to the cells of a
table/matrix, that defaults to true. When it is set to false it
could force the data to be on one line, and not wrap down to
another line, forcing the column to widen to accommodate the
single line of data.
-
In preview view there could be the ability to resize the columns
(as you are seeing the data) and when you switch back to design
view, you could have a messagebox asking if they would like to
save the changed column widths - this would be like an Access
datasheet.
-
Sample report showing Recursive Data
There should be a sample report added that demonstrates a report
that uses recursive data.
We suggest showing the Employees and Managers in Adventure Works,
as managers are employees too and can also have their own
managers. This should be shown using padding to achieve the visual
nesting.
-
XML Data Sources should accept XPath
While working with XML Data sources, you really should be able to
use XPath to query the data that the .xml file or webservice
returns.
This functionality would make it easier to work with XML data that
contains multiple data sets, and would make XML Datasources
generally more usable.
Figure: Entering a query into the "Query string" box for an XML
data source causes no data to be returned... it should accept
XPath
-
The NoRow property on table control should be improved to allow
more control.
In Access, we have NoData event to handle when there is no data
returned from data source, this feature has been migrated into a
NoRow property of Table control, which allow you to set a message.
Figure: NoRows property of table control in Reporting Services
Compare to Access, this is much easier to use, but we lost our
control over the message, we cannot even set our error message to
Red color. See our
Rules for Better Reporting Services.
More advanced property should be allowed for this, such as
changing color, font, etc.
-
Pagination does not work with hidden items for HTML output
We have a report which has a table with some hidden items. These
hidden items will be collapsed initially in the HTML output.
Pagination does not work for this report - all the data show in one
page. This is horrible for huge data report.
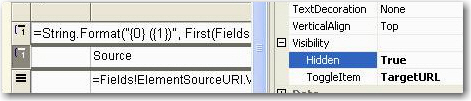
Figure: Hidden item in report
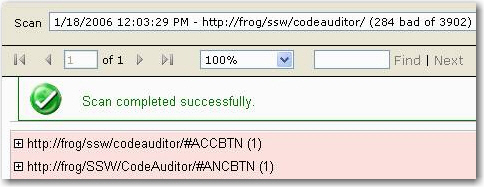
Figure: Pagination does not work with hidden item
But the pagination works if we make those items visible initially
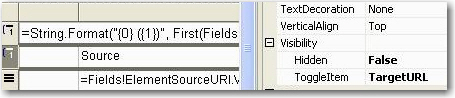
Figure: No hidden item in report
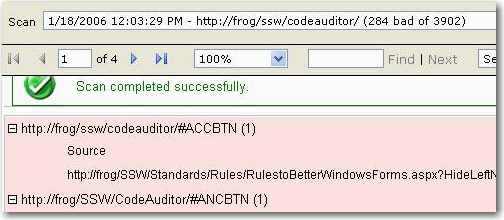
Figure: Pagination works well with no hidden items
There's no way to have pagination and collapse work in same report.
-
Choose how IIS authenticates clients
We think that we should have the ability to choose how IIS
authenticates clients - read our Reporting Services suggestion. IIS
should be able to:
- Try Integrated authentication first
- Then use the Anonymous username (if specified)
- Then prompt for a user name and password to use.
-
No need of page break in subscription email with render format of
Web Archive
Page break is a useful feature for big report to avoid performance
issue when viewed in browsers. However for a report subscription
email (select Web Archive as Render Format in subscription
settings), page break causes redundant headers and footers and make
the email difficult to read.
Figure: Report in a subscription email
Figure: redundant report header following a page break
-
Report subscriptions are disabled if a report contains User
information e.g. User!UserID
Figure: This report footer with "User!UserID" will give problems
later when setting up subscriptions
|
From:
Daniel Hyles www.ssw.com.au
To:
James Zhou www.ssw.com.au
Cc:
Adam Cogan www.ssw.com.au
Subject:
RE:GroupHealth
Importance:
High
James,
Ever since you made changes to this report the data bound
subscription does not work. When I attempt to fix it I get
The '/WhatsUp/GroupHealth' report has user profile
dependencies and cannot be run unattended.
(rsHasUserProfileDependencies)
|
Best practise for reports is to have the User!UserID in footer as
per rule
Do you include a useful footer at the bottom of your reports?
However later when dealing with subscriptions you may get this
email:
Figure: Disabled Subscription
The fix is to remove the "User!UserID" from the footer to enable
subscriptions. In Reporting Services 2005, they have improved this
- normal subscription is enabled, but Data-driven subscription is
still disabled in this case. The behaviour should allow the report
to work and a different value entered for UserID eg."N/A"
-
Fix all inconsistent names – where different names have been
used for the same properties
I was very familiar with CanGrow and CanShrink but was not
familiar with what ‘Can increase to accommodate
contents’ was. Imagine my surprise when I find out they are
the same thing!
Figure: “Can increase to accommodate contents” is
the same as “Can Grow” – they should be named
the same
-
Schedule printing a report directly to a printer
Some senior executives do not open their email. For this reason,
it would be useful to be able to schedule for a report to be
printed directly to a printer.
Figure: Option to allow printing a report on a schedule
-
Image display
Reporting Services report doesn't support transparent image
background. When you use embedded images in the report, if the
image file's background color is "transparent", it will only
display correctly in designer (VS2005), but if you view the report
in IE, the image will have a shadow background which is bad.
Figure: Image with transparent background
Here is a workaround. You need to change the image's background to
"white" in order to remove the shadow.
Figure: Image with white background
-
Image size is not correct in subscription
Reporting Services subscription report doesn't support image
resize. In designer (VS2005), you can set the image box's "sizing"
properties as "FitProportional" to allow a large size image file
displays correctly in image box, but when we use the subscription
to send the report as an email, images display incorrectly with
its original size.
Figure: Image can't be resized
When you reply or forward the report email, images display as
their original size, report can’t apply the "sizing"
properties of image box in here.
Figure: Image with original size
Here is a workaround. In order to make the report look more
consistently, you have to change the image file size to a proper
size to fit the image into the box.
-
Add trigger in report subscription email to resend report
Reporting Services 2005's subscription can be triggered by time,
it can send a report email at a preset time. After you receive the
email, if you want RS to resend the report, you have to wait until
the subscription is triggered again.
Add a trigger in the report subscription email will make the
Reporting Services more convenient.
-
Sample Reports for Report Execution Log doesn't work properly
Created a new job for Retrieving Report Execution Log Data
successfully as per
Configure Server Management Report Samples
, then it was executed failed.
Figure: executed failed for this job;
Figure: Could not find stored procedure
'msdb.dbo.xp_sqlagent_notify' for RSExecuteLog which was created
by running Createtables.sql (under C:\Program Files\Microsoft SQL
Server\90\Samples\Reporting Services\Report Samples\Server
Management Sample Reports\Execution Log Sample Reports by
default);
It is because of missing stored procedure "dbo.xp_sqlagent_notify"
for "Report Execution Log" Database, Microsoft should make sure all
samples databases and reports works properly! And it said that this
error will be fixed in SQL Server 2005 SP2 - See
Could not find stored procedure 'msdb.dbo.xp_sqlagent_notify'
for more details.
-
Improve compatibility for Firefox
Reporting Services Reports (2005) makes beautiful reports, well it
does in IE, but the HTML is not good for some non-IE browsers (aka
Firefox). Reports are displayed in an IFRAME that's deep in nested
table land, and the IFRAME's height setting only works in IE. This
cause reports can't display correctly - the IFRAME's height defaults
to a few hundred pixels, so you only see the top 2 inches of the
report. Like this:
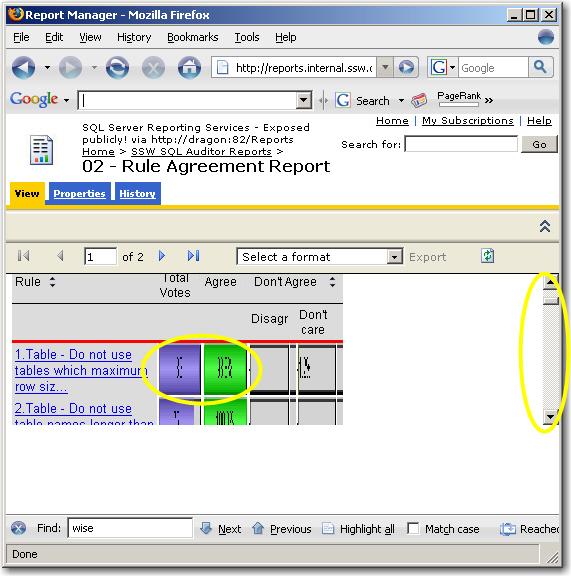
Figure: Reporting services report in Firefox looks terrible
Workaround: though we can fix it by adding a min-height into
ReportingServices.css file (it's found in "C:\Program
Files\Microsoft SQL Server\MSSQL.3\Reporting
Services\ReportManager\Styles\" by default):
/* Fix report IFRAME height for Firefox */
.DocMapAndReportFrame
{
min-height
:
860px
;
}
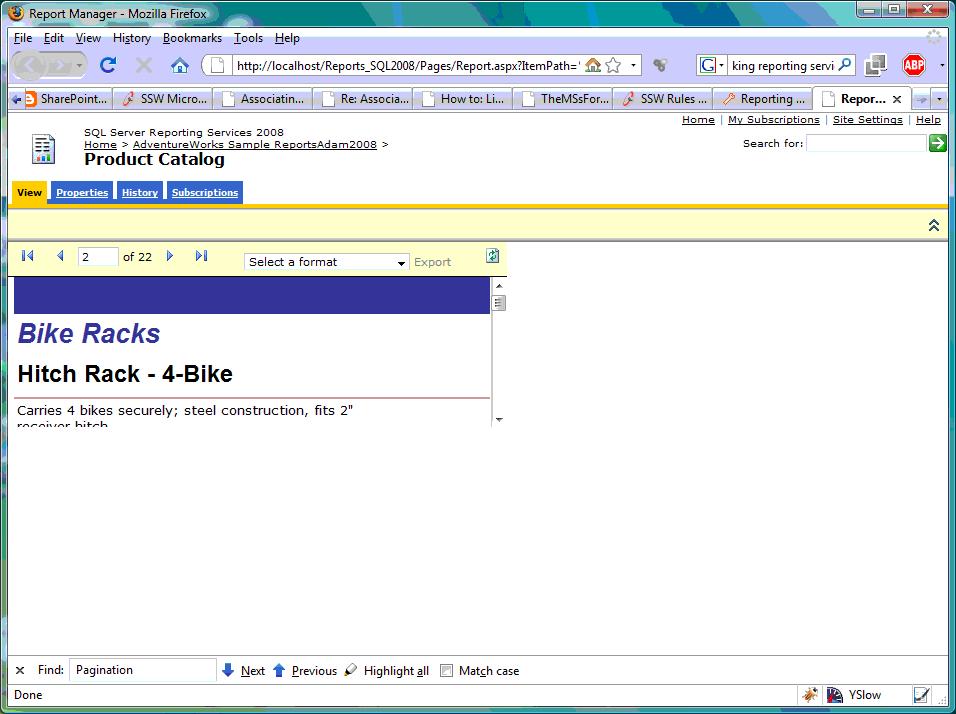
But the report still can't display in correct width even if you
added a min-width element, like this:
Figure: Reporting services report in Firefox still looks terrible
after fixed height problem
This problem still has not been fixed in SQL Server Reporting
Services 2008.
There are several ways to try to resolve this, but none can fix it
completely. (See
Reporting Services CSS-fix for Firefox
for more)
-
Add progress prompt on the Exporting Progress Form
Sometimes exporting takes forever, it should give the progress
prompt (e.g. xx% complete) on the exporting progress form, so we can
know where it is up to.
Figure: Exporting takes forever
-
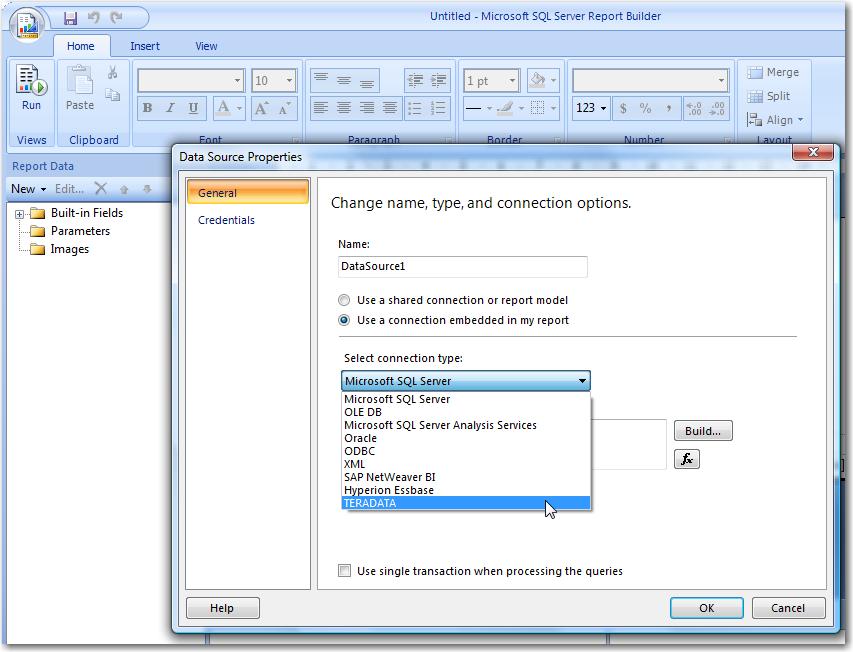
Add a special data source type wrapper for Access
Many Access developers think that Access is ODBC compliant –
but not OLE DB... So we suggest:
-
Add a special wrapper called Jet over ODBC (Access) to the list
then you can just select an MDB
-
- Figure: Choosing Data Source Type
-
Make the IIS service more visible
What is required for RS to work? Well you check both services (SQL
Server and SQL Server Reporting Services) are running in SQL
Server Configuration Manager, and then you check you have all
green ticks in Reporting Services Configuration Manager. What if I
check these and Reporting Service is still not working... what
could it be?
-
-
Figure: Both services are running in SS Configuration Manager
and all green ticks in RS Configuration Manager, but RS is still
not working
The answer is IIS is not running:
-
-
Figure: IIS is not running. This should be more visible on both
the above pages
We suggest:
-
On SQL Server Configuration Manager add "SQL Server Required
Service (IIS)"
- On Reporting Services Configuration Manager add "IIS"
This makes this service more visible to users and makes it a true
one stop shop (instead of finding and using Computer Management).
-
Add back the different icon for calculated values
Unlike those in Visual Studio 2003, the icons of every kind of the
fields are the same in Visual Studio 2005. It becomes not easy for
the developers to separate the calculated values from the original
ones.
So we suggest adding back the special icon for calculated values
-
-
Figure: In VS2003, the icon of calculated values is different
from others'.
-
- Figure: In VS2005, all the icons are the same.
-
Make this error more friendly by making it visually consistent
with the SQL Server Configuration Manager
I would not normally comment on error messages, but these ones are
commonly seen.
Ideally you should not have to read the error message to be able
to fix it
As a minimum I would add the same icon and text from the SQL
Server Configuration Manager
Slightly better would be an image with a circle around the missing
reference
Ideally I would provide a link that opened the Microsoft
Management Console (aka MMC snap-ins) – I would not even
mind if it required you to allow “Active Content”
inside IE (like Index.htm on MSDN Subscription DVD)
-
-
- Same for this error message
-
Make the title of the report more descriptive
The report <title> tag needs to be more descriptive, as
non-descriptive title will reduce your Google rankings. See
Are your <title>, <h1>, and <h2> tags
descriptive?
for more information.
-
- Figure: Non-descriptive report title
We have a suggestion to make the report title more descriptive,
see
Add the ability to dynamically change the title of the report
.
-
Make every report has its own deployment path
We should be able to choose the folder that a report deploys to,
rather than having to create a separate project for each
deployment path.
-
- Each project has only one deployment folder
-
-
Reports don't have their own deployment path property, so the
reports in one project can be deployed to the same folder only.
-
Add built-in date function
There should be built-in date functions to calculate Week Ending,
Month Ending and Year Ending for a date, like
GetCurrentWeekEnding(), GetLastMonthEnding(), so we can get the
report of weeks and months easily.
The week ending function needs to consider the local culture while
calculating. In different countries, the weekend day may be not
the same. So this function should accept a parameter to load the
local information, such like User!Language or something like that.
And of course it should have a parameter to let the user set which
day of the week is the week ending day manually (e.g. Friday or
Sunday)
-
(SELECT CONVERT(char(10), DATEADD(day, - (1 * (DATEPART(weekday,
Agreement.ProjectedDepositPaymentDate) - 6)),
Agreement.ProjectedDepositPaymentDate), 103) AS Expr1) AS
ProjectedDepositPaymentDateWeekEnding
- This is how we get the week ending now
-
(SELECT GetWeekEnding(Agreement.ProjectedDepositPaymentDate)) AS
ProjectedDepositPaymentDateWeekEnding
-
using build-in functions would be efficient and more readable.
-
Help more on the expression builder
When user press OK on the expression builder:
-
- Figure: Expression builder
It should try to help more and more... E.g. Show a dialog like:
Did you refer to a control instead of a dataset?
You have used the function CountRows("Scans") that refers to a
control "Scans".
Did you instead mean the dataset "dsScans"?
"Yes - Correct this" "No - Leave it"
-
Add a lookup form to search the big table
-
It is confused for user to input an unknown value. Also, it
isn't feasible to use a combo to contain more than 30,000
records.
-
- Figure: Bad Search
-
What do you think of this suggestion
Use a ellipse button with a popup search form (better than
using a combo when you have >100 records)
One tab will do – but 4 tabs would be better
http://www.ssw.com.au/ssw/nettoolkit/02WinSearch.aspx
-
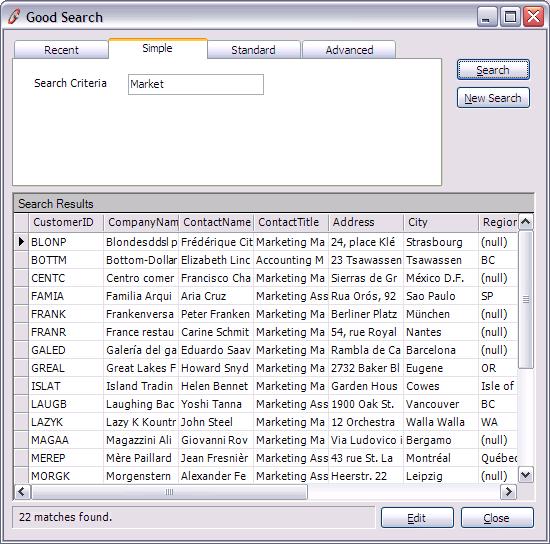
- Figure: Good Search
-
Insert dataset as a table (with totals)
-
Productivity Suggestion
Under “add” item, add right click menu
“Insert dataset as a table (with totals)”
-
Auto generate the dataset’s name to the title at the
top of table.
- Auto generate every column of dataset.
- Auto generate Totals row at the bottom of table.
-
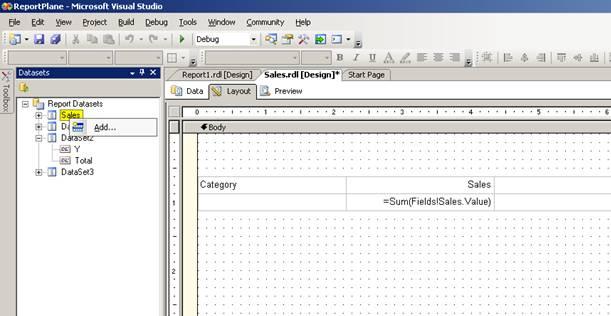
- Figure: Insert Dataset as table
-
Report Wizard Intelligence
It is not convenient for developers to generate SQL without
intelligence in Report Wizard. They have to look for the table
name or the field name in SQL Server Management Studio and
generate SQL. If there is an intelligence in textbox or table list
in the left hand navigate, it will be much better.
-
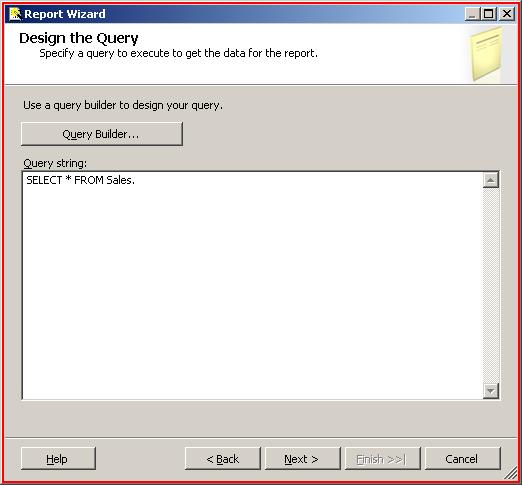
- Figure: Report Wizard without Intellisense
The goals are to help me get to this…
-
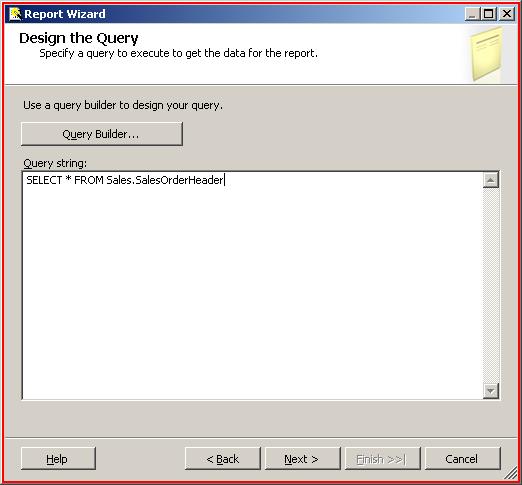
- Figure: Report Wizard with Intellisense
-
Make long-running processes user-friendly
When your wizard has a lot of processing, allow the user to skip
that processing when appropriate. Show a status description
information above the progress bar and also allow users to cancel
the process. After processing finished, it should jump to the next
wizard.
See our rule on Rules to Better Interfaces at
SSW Rules to Better Interfaces
-
Change No Bold
UI problem – when Visibility is collapsed there is no bold
(even though the setting is not at default). So we need to see
bold when collapsed
-

- Figure: Change No Bold
-
Dataset from another report
Often you want a dataset from another report (or another project)
On the “Data” toolbar add some buttons
“Copy dataset from”
“Import from XML”
“Save as XML”
Note: Not only do I want to select a project, then report….
I want to be able to select a published report (select a server,
then report, then dataset)
-
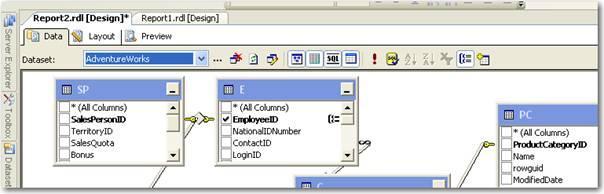
- Figure: Selecting dataset from another report
-
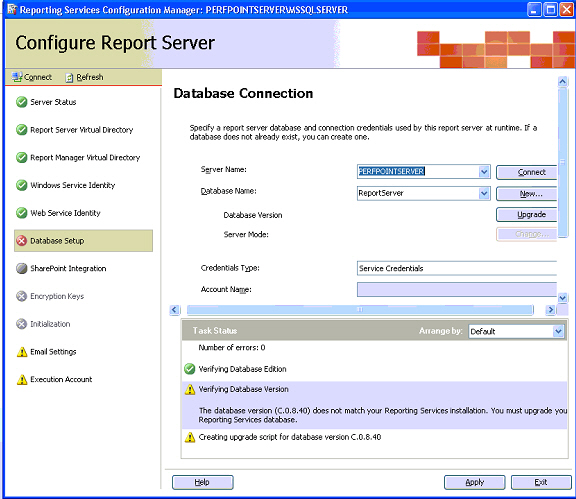
Add tick to check if Reporting Service is the latest
If the version of Reporting Service can't match that of Database,
there will be a warning to let user upgrade. Can we have a tick to
say Reporting Service is the latest or where we can download the
latest version.
-
-
Figure: Version of Reporting Service can't match the Database
-
Let SharePoint work with Reporting Service easily
It is not easy for user to configurate SharePoint and Reporting
Service working together. If is much better to click one button
and they can run in the same box smoothly without knowing anything
special.
-
More information on SharePoint Integration
The “SharePoint Integration” page in Reporting Service
Configuration Manager is too simple, we need more information on
this page to tell our users:
- What will be the new functionality to add in SharePoint?
-
How to generate RS reports by using SharePoint Integrated mode?
- How to manage reports in SharePoint?
-
- Figure: Simple information in Reporting Services Manager
-
Sample in the reports document library
It is not easy for users to build report in SharePoint without
tutorial. If there are some sample reports in SharePoint, users
can refer to the samples and learn by themselves.
-
- Figure: Add sample in reports document library
-
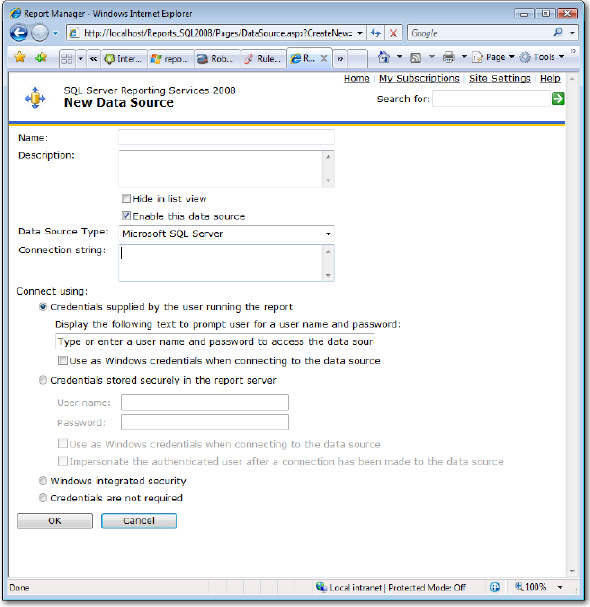
Test data source connection
Users can create a report data source in SharePoint, but they
don't know the connection string is not correct until the report
raises error. So there should be a test button to check the
connection string.
-
- Figure: No button to test the connection string
-
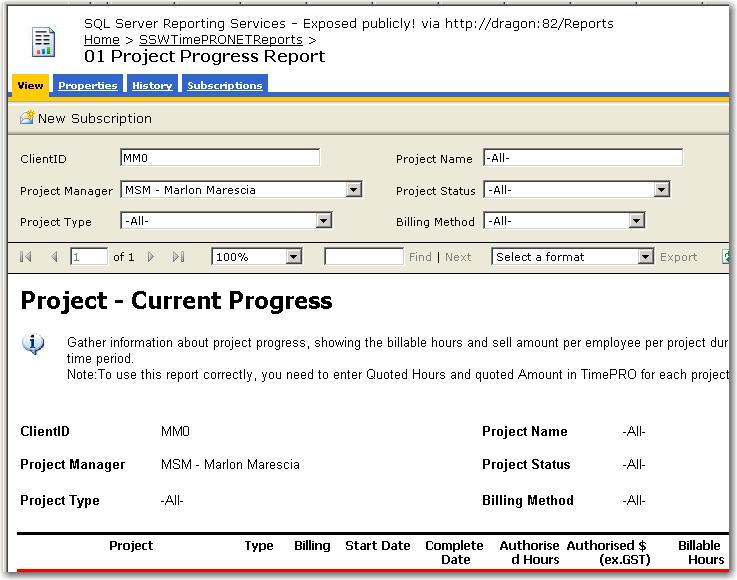
The subscription needs an extra Name field
The current UI doesn’t have a name filed, make it impossible
to tell the difference between each of the subscriptions.
-
- Figure: Need to add a Name field
-
Highlight the current field in yellow in the "Diagram Pane"
Highlight the current field in yellow in the "Diagram Pane" (aka
Query By Design window) when you select a row in the "Grid Pane"
it would be so useful when you are working on an unfamiliar
database schema
-
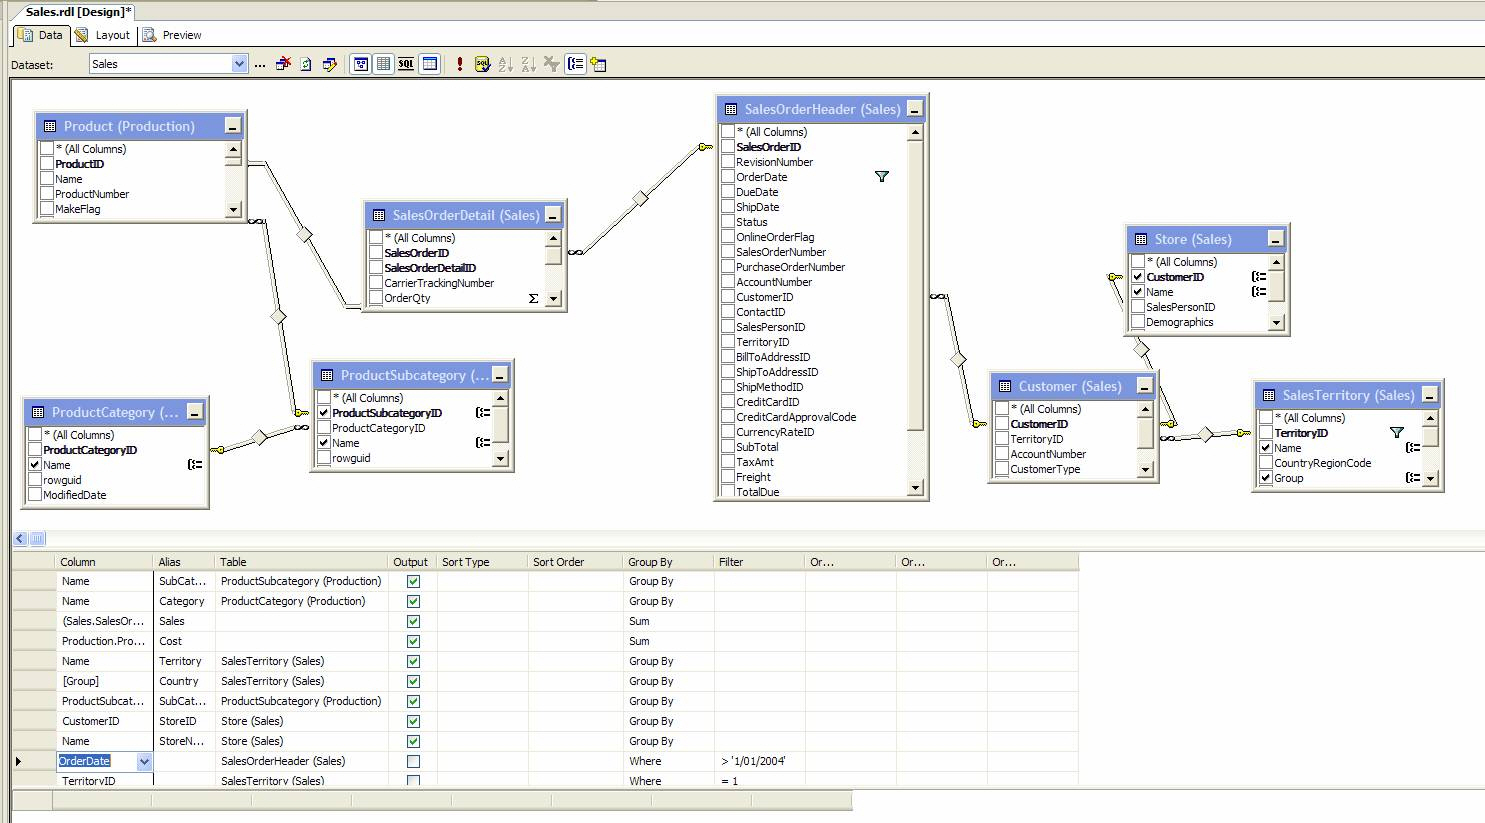
Figure: The Diagram Pane without any highlights
-
Add a page to configure the export format
Currently, if we want to configure the export format, we have to
edit the .config file mannually. It is much better to add a
configuration page and allow users to add or remove report export
formats easily.
-
- Figure: Export Format List
-
Add a connection string builder
We really need a builder for a connection string
I can never remember the right syntax for the "Connection String"
textbox
(As a minimum it would improve the demo experience for presenters)
-
-
Figure: Building a connection string is too hard – we need
a builder
-
Allow me to report against both LINQ Data Sources (.edmx and
.dbml)
Ideally I would love to do a report based on a .dbml or .edmx file
I just select a LINQ (.dbml or .edmx) file as the datasource of a
report
Plus I would like some samples added so we have an instant demo.
-
Report Builder 2.0 - Offer the ability to report against
SharePoint
A few new ones in this list... but when will be able to select a
SharePoint list?
PS: Back in 1992 Access would not have been as popular as quickly,
without the ability for users to be able to query their data...
SharePoint Lists are the new Access (for Power Users).
-
- Figure: SharePoint list is not supported
-
Allow Vertical text writing mode to also have bottom to top
Text boxes at the moment only allow writing modes of top to
bottom. This is not always the way report viewers want to read the
report. There should be another option of bottom to top, i.e.
bt-lr.
See the images and explanation on
Rules to Better SQL Reporting Services - Use Vertical text for
Columns
-
Add parameter type for common periods
we look for common period parameter type like week, month or
quarter instead of having to specify start and end parameters of
datetime.
-
Interactive Sort does not work well with chart
We found a problem of Interactive Sort column with chart within
it:
-
- Figure: design view
-
- Figure: preview view
-
- Figure: error when sorting
-
Reports should have an easy way to email to another person
There should be an option which can make the users send the report
by email directly.It's more convenient.
-
- Figure: There should be an option "Send Email"
-
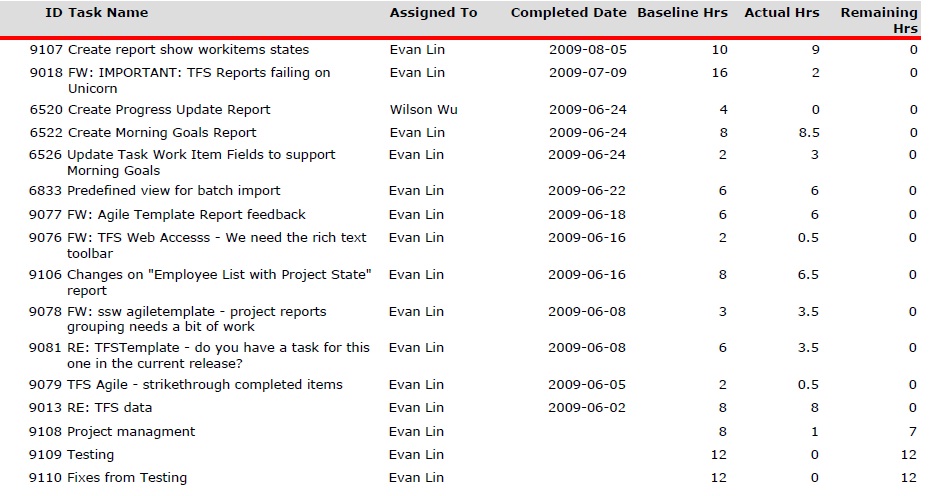
Show strikethrough in exported PDF file
When report has strikethroughs(with the TextDecoration property
set to "LineThrough"), it looks fine in Report Viewer. When export
to PDF format, the resulting document does not have the
strikethrough applied.
-
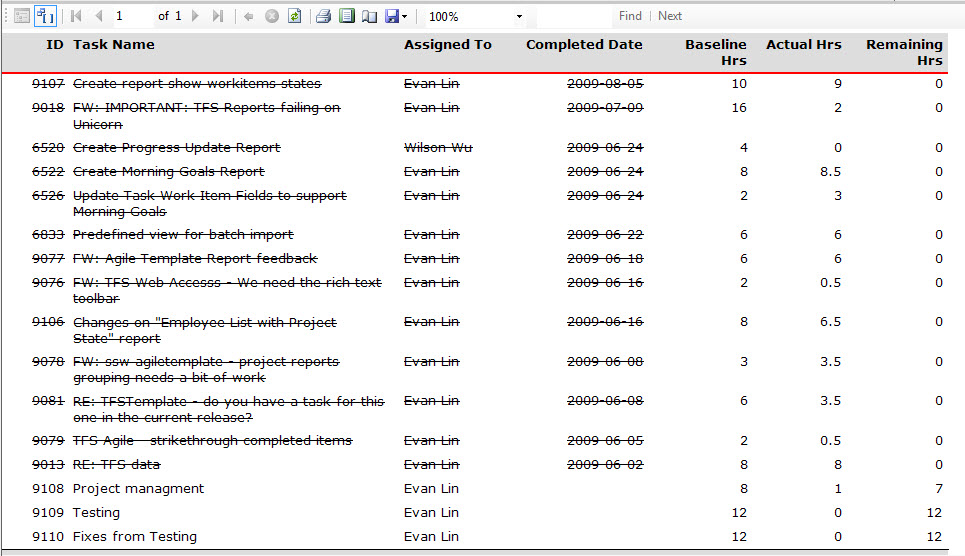
- Figure: Strikethrough works fine in Report Viewer
-
- Figure: Strikethrough doesn't work in PDF
It is a known bug that you can check on Microsoft Connect.
-
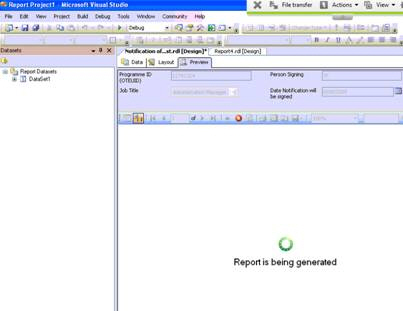
Developing - Sounds
We need a "completed" sound after rendering a slow report. The
problem is after 30 seconds of waiting you ALT+TAB to another
window and forget when it finishes.
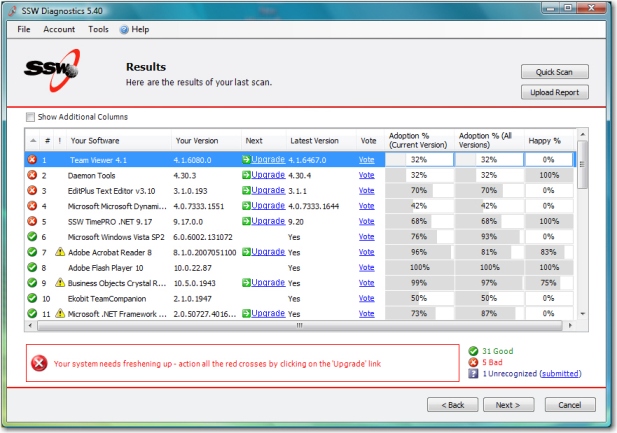
A good example is the sound on the long process on
SSW Diagnostics
More info at
Rules to Better Interfaces - Long Process - Do you know how to
make long-running processes user-friendly?
-
-
Figure: When Developing slow reports, please play a sound once
the reports renders
-
-
Figure: SSW Diagnostic will play a sound when the report
successfully generated.
-
Give users a runtime option to increase or decrease decimals
places
In some cases, the nubmers need to be accurate and reconciliations
for the users, while in other cases, the decimal places are not
required in the report.
So we need a runtime option to add/remove decimal place.
-
-
Figure: For some users, like accountants, the decimal place is
necessary; for others, it might be not.
-
Linked Reports - No hyperlink available to Linked Report on
Property General page
Reporting Services 2005. Linked Reports, when you look at the
Properties tab it shows the path of the "parent" report and a
button to "Change Link" but there is no quick link to take you to
that parent report. You have to navigate to all the folders to get
to it.