-
Do you use the best tools to present Reports to users?
There are many ways to present your data to users over the Web. In
general, most reporting needs can be grouped into the following 2
categories:
-
Detail Reports -
Printable reports that show detailed information for each row in
the database. (e.g. an Invoice)
-
Summary Reports -
Business Intelligence Reports that group and summarize data into
counts and sums of individual rows (e.g. a Monthly sales with a
chart). Typically, OLAP oriented tools MS Excel in this area.
The obvious choices for displaying this data are
SQL Reporting Services 2012
,
ASP.NET 4.5
,and
Crystal Reports
. Let's take a look at how easy it is to complete this report
using these and other solutions.
Below is a guide on the best options available for the Microsoft
platform, with Pros and Cons for each.
The scenario
Scenario: I want my customers and staff to be able to see this
data in a useful format. What are my options?
Start Date: 1/1/2014
End Date: 1/4/2014
|
Product
|
Downloads
|
| SSW Upsizing PRO! |
181 |
| SSW Code Auditor |
114
|
| SSW .NET Toolkit |
63
|
|
SSW Performance PRO! (for Access 2000,2002,2003)
|
60 |
| SSW Exchange Reporter |
58 |
|
SSW Exchange Team Calendar (for Exchange Server 2000,2003)
|
53 |
| SSW Diagnostics |
49 |
| SSW SQL Total Compare |
49 |
| SSW SQL Auditor |
39 |
|
SSW Access Reporter .NET For IIS
|
34 |
| SSW SQL Deploy |
33 |
| SSW eXtreme Emails! |
31 |
|
Total
|
764
|
Conclusion
For building reports, the most critical factors for a power user
are:
- Development time
-
Having the ability to put the reports on the web and having them
to work on your iPad too (without installing an app)
- Having drill down functionality (for summary reports)
-
Having reports with a query string and the parameters on it
(e.g. so that you can click a link in the email)
- Offline support (only if absolutely neccessary)
Which solution should I use when doing detail type reports?
(usually printable ones e.g. an Invoice)
Because you can't control the report length and need strong layout
control, a proper reporting solution is the best option. Hence
Reporting Services and Crystal (although not naturally my second
choice). But the fact is you just dont know if the report is going
to be multiple pages so:
- Web and Windows - SQL Reporting Services
Which solution should I use when doing summary type reports
(usually business intelligence ones e.g. monthly sales with a
chart)
Below is a general guide as to the order we choose for summary
reports (BTW - This list is not set in stone and we use all
the below options for different clients):
- Web and Windows - SQL Reporting Services
- Web - MVC and Kendo UI
- Windows - Excel
-
SQL Reporting Services 2012 (Web and Rich Client)
SQL Reporting Services
http://msdn.microsoft.com/en-us/library/ms159106.aspx
Pros
- Short development time - 3 hours for sample report.
- No code.
-
You can export reports to a large number of different formats
right out of the box (Excel, PDF, HTML, Word, Images).
-
You can schedule report execution and have your reports emailed
automatically to you or a list of recipients (via Data-Driven
Subscriptions).
-
Developers can create reports using Visual Studio Business
Intelligence Development Studio
-
End Users can create ad-hoc reports using the Report Builder 3.0
click once application (same functionality as Visual Studio)
-
Parameters are easy to add to the report and bind to the data.
- Grouping is simple.
- Drill Down without needing a tree view control.
- Built-in security module out of the box
- Rich set of charting controls and geospatial controls
- Reuse report parts in many reports
- Client side reporting using RDLC
-
Can easily integrate into SharePoint to make publishing and
sharing reports simple
Cons
-
Limited control set (although the controls are very rich). You
are forced to use built-in controls. For example, you can't have
"next month / previous month" hyperlinks like in ASP.NET (see
below)
-
Query string doesn't change when you change the parameter values
in a report. You have to re-submit the page (no AJAX)
-
Can't separate SQL into a strongly-typed dataset or middle-tier
objects like in ASP.NET (unless you write a lot of code to
support your own provider)
-
Difficult to integrate user input and dynamic behaviors like
ad-hoc grouping
<
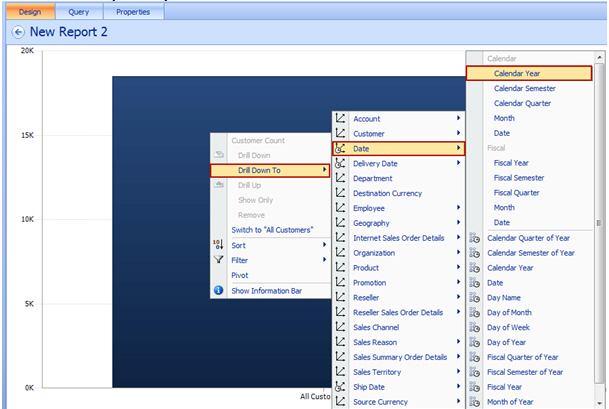
-
- Figure: SQL Reporting Services 2012
Note: When comparing two sets of values in a report, you should
avoid showing change as a percentage
Conclusion
Reporting Services is the way to go if you do not need
- Dynamic grouping.
- To write to your database via the report.
Samples
SSW Exchange Reporter (Samples)
Note: When comparing two sets of values in a report, you should
avoid showing change as a percentage
-
ASP.NET MVC (Web Forms)
If you have the skills, you should use MVC. This is for those who
prefer the Web Forms.
Pros
-
Query Strings supported (e.g. URL can be emailed to another user
who can then see the correct report).
-
Complete Control over the parameters - e.g. "Current Month"
hyperlink
- Complete control over the rendering of the output
- Can edit data via Databound Controls
- Sorting via hyperlinks possible
-
Can make the reports more interactive, allowing such
functionality as dynamic grouping, sorting and filtering
Cons
-
Long development time of sample report - 8 hours to convert
including formatting,
sorting
and adding 3rd party parameter controls (like Date Time
Pickers).
-
Difficult to create reports that print adequately, although it
is possible to do with CSS Printing.
- Multiple Page reports impossible.
-
Cannot run offline unless the database is replicated and hosted
locally (not recommended)
- Very difficult for Users to create reports
-
Graphs - To show a graph you need to code OWC to generate a .png
or get a 3rd Party Control like Dundas Charts
-
No Date/time picker built in - have to use a 3rd party control
or the AJAX Toolkit (or write your own)
-
No export to PDF or other formats - you have to install Acrobat
and print to PDF from the browser
-
No nice Reporting Services interface - you have to create the
navigation yourself
-
Have to configure security from scratch (e.g. using the ASP.NET
membership and roles providers).
-
Hard to do drill-down. To do this, you need a Treeview with code
- There is OLAP support but you need to know MDX.
Conclusion
Good if you:
-
Want to edit data in your report (e.g. the ASP.NET Bindable
controls like the DataList and GridView have edit modes)
- Want dynamic grouping and cannot go to OLAP
Samples
More at
http://www.asp.net/downloads/archive-v11/starter-kits/reports
-
- Figure: SSW Product Download Report (ASP.NET)
-
Protected Sub Page_Load(ByVal sender As Object, ByVal e As System.EventArgs) Handles Me.Load

        If Request.QueryString("DateFrom") <> "" Then
            txtDateFrom.Text = Request.QueryString("DateFrom")
            txtDateTo.Text = Request.QueryString("DateTo")
        End If


    End Sub

    Protected Sub Button1_Click(ByVal sender As Object, ByVal e As System.EventArgs) Handles Button1.Click


        Response.Redirect(Request.Url.AbsolutePath.ToString + _
            "?DateFrom=" + HttpUtility.UrlEncode(txtDateFrom.Text) + _
            "&DateTo=" + HttpUtility.UrlEncode(txtDateTo.Text), True)


    End Sub
-
Figure: ASP.NET - Code to read from and write to the query
string
-
        ...
		<asp:GridView ID="GridView1" runat="server" AllowPaging="True" AllowSorting="True"
            AutoGenerateColumns="False" BackColor="#DEBA84" BorderColor="#DEBA84" BorderStyle="None"
            BorderWidth="1px" CellPadding="3" CellSpacing="2" DataSourceID="SqlDataSource1">
            <FooterStyle BackColor="#F7DFB5" ForeColor="#8C4510" />
            <Columns>
                <asp:BoundField DataField="FileNameURL" HeaderText="FileNameURL" SortExpression="FileNameURL" />
                <asp:BoundField DataField="ProdName" HeaderText="ProdName" SortExpression="ProdName" />
                <asp:BoundField DataField="DownloadCount" HeaderText="DownloadCount" ReadOnly="True"
                    SortExpression="DownloadCount" />
                <asp:TemplateField HeaderText="Graph">
                    <ItemTemplate>
                        <img src="Images/chartpixel.gif"
                             height="10"
                             width="<%#DataBinder.Eval(Container.DataItem,"DownloadCount")%>" />
                    </ItemTemplate>
                </asp:TemplateField>
            </Columns>
            <RowStyle BackColor="#FFF7E7" ForeColor="#8C4510" />
            <SelectedRowStyle BackColor="#738A9C" Font-Bold="True" ForeColor="White" />
            <PagerStyle ForeColor="#8C4510" HorizontalAlign="Center" />
            <HeaderStyle BackColor="#A55129" Font-Bold="True" ForeColor="White" />
        </asp:GridView>
		...
-
Figure: ASP.NET - Implement the bar chart in the grid;
-
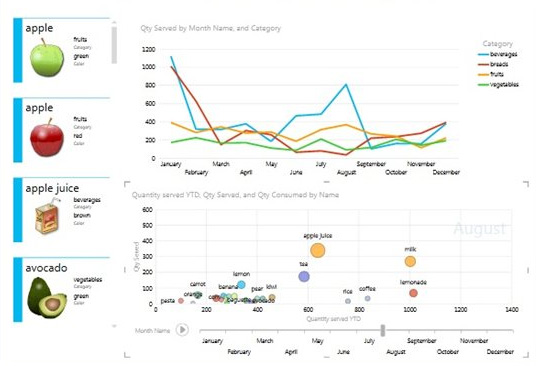
Kendo UI
Check out the
Kendo UI website
.
-
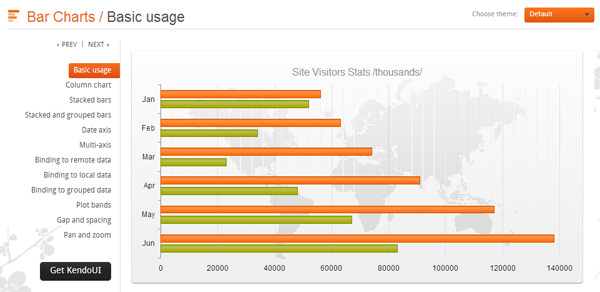
- Kendo UI report sample
-
Power View
http://thinknook.com/sql-server-powerview-2012-demo-video-2012-02-25/
-
- Power View report sample
-
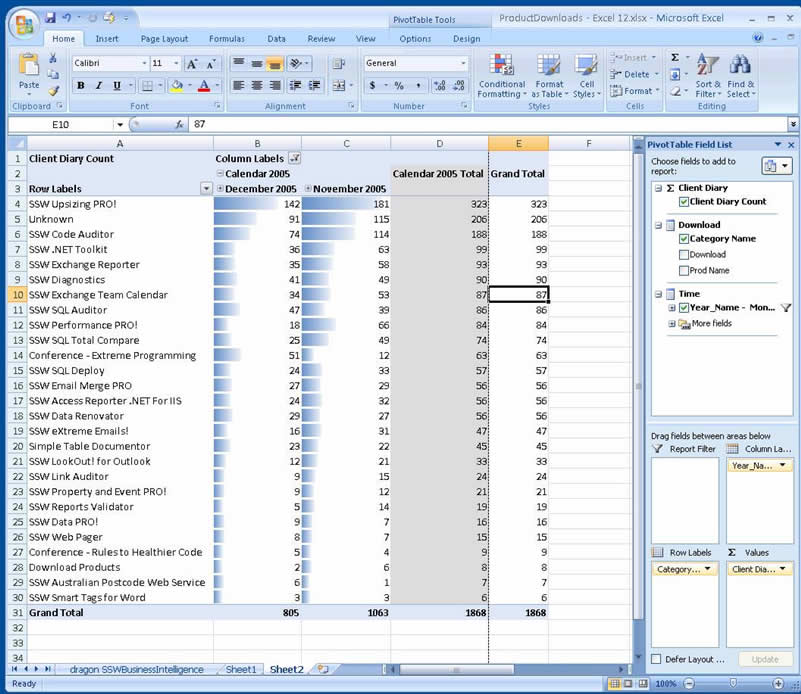
PowerPivot
Check out the
PowerPivot official site
.
-
- PowerPivot
-
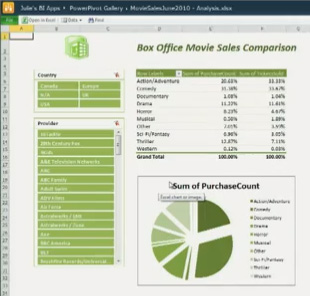
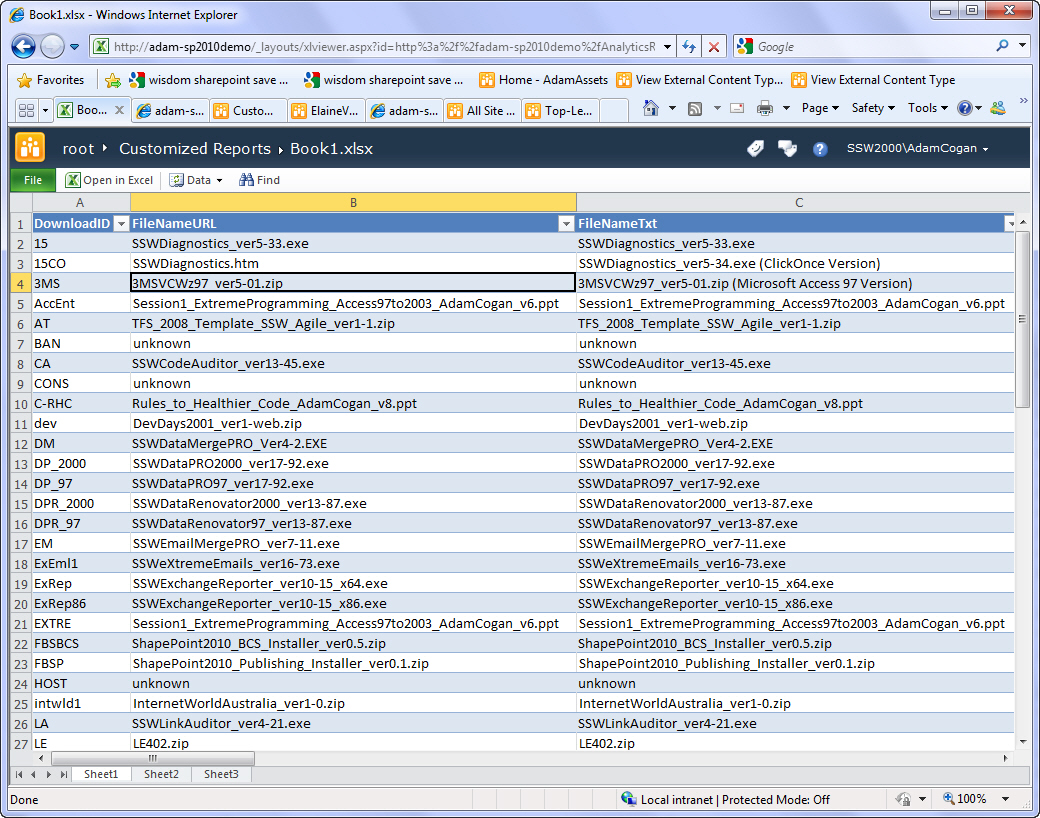
Excel 2007/2010/2013 Data Visualization with SharePoint
2007/2010/2013 Excel Services
-
-
Figure: Office Excel 2007/2010/2013 delivers new powerful data
visualization tools
-
-
Figure: SharePoint Excel Services brings the spread sheet onto
the web
Pros
- Can run over the Web via Web Services
- Hides the Complexity of OLAP
-
End Users can change it; most users are very familiar with Excel
- A visually appealing UI
- Full drill-down support with support for Cubes
-
Can publish to SharePoint and allow users to interactively use
the report, also gives you full version control
Cons
- Requires rich client Install
- Requires the Excel 2007/2010 License
- Requires SharePoint 2007/2010 License for Excel Services
-
-
-
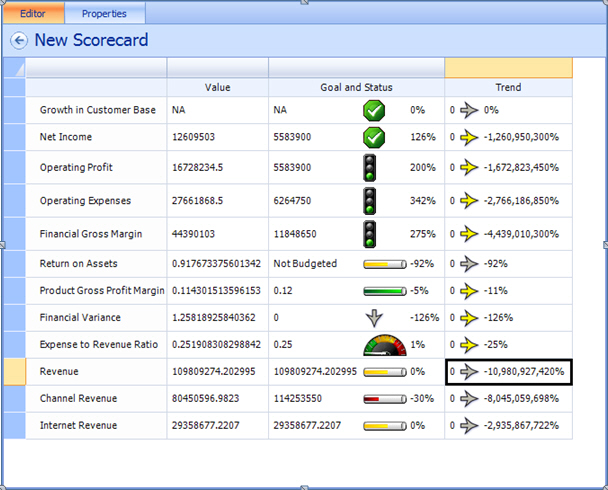
Figure: PerformancePoint allows users to easily create KPI
reports
-
-
Figure: PerformancePoint allows users to drill through on charts
to get more details
Pros:
-
Easy user interface for creating KPIs, Scorecards and Dashboards
- Can share the data using SharePoint
- End users can change the reports
- Full drill down and drill through support
- Rich client is deployed using ClickOnce
Cons:
-
Requires SharePoint 2010/2013 with PerformancePoint 2010/2013
licence
-
Crystal Reports (Windows and Web)

-
-
Figure: We used Crystal (Windows) for our SQL Auditor tool to
support disconnected opterations.
Pros
-
Quicker to develop than ASPX (around 5 hours for the sample)
-
(Windows Client) Doesn't require a server-based product like SQL
Reporting Services - can run offline
- Great Printing - Easy to export to .pdf for printing
- Easy to export to .xls for analyzing
- Very fine control over output appearance.
-
Integrates well with .NET Strongly Typed Datasets and Objects.
- Good Drill down feature.
- There is OLAP support but you need to know MDX.
Cons
- Custom Development environment
-
Licensing is very expensive for more than 5 concurrent reports
- No sorting hyperlinks
-
(Windows Version Only) QueryString cannot be emailed to another
user
- Dead technology
Conclusion
Quite expensive for Web Clients - Only use on solutions that have
a big investment in Crystal or you require an offline ability for
a product (Windows Client only)
|
George Doubinski
said it best: "My major pain with Crystal has been stability
of their development environment. Im not sure if they've
done anything in 2.0 but in 1.1 it was nearly unusable. The
hoops to jump through to simply change data source was
bordering on insane, for example. The other issue is,
obviously, cost when scaling."
|
-
DataDynamics Active Reports (Web and Windows)
Basically an alternative if you were to choose Crystal.
http://www.datadynamics.com/

Pros
- Cheaper Licencing than Crystal (Royalty Free)
- Xopy deployment of reports
-
(Windows Client) Doesn't require a server-based product like SQL
Reporting Services - can run offline
Cons
- Support for product not as widespread
- Not in bed with Microsoft like Crystal
-
There is OLAP support but you need to know MDX.
-
XML/XSL (Windows and Web)
Pros
-
Can do great things like
http://www.amorphous-media.com/client_demo/xmlreports/student_app.htm
- Can have client side filters and sorting
-
(Windows Client) Doesn't require a server-based product like SQL
Reporting Services - can run offline
Cons
- Very long development time
- Impossible to make it print for multiple page reports.
-
There is OLAP support but you need to know MDX.
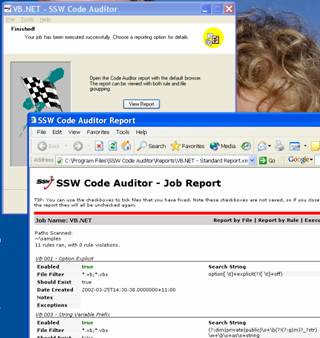
Figure: We used this method for reporting in the SSW tool Code
Auditor (a Windows Forms application)
-
Access (Rich Client and Web via SSW Access Reporter)
This solution has worked since Access 97 to Access 2010 and 2013
Pros
- Good Report development environment
- Very good printing support
-
(Windows Client) Doesn't require a server-based product like SQL
Reporting Services - can run offline
Cons
-
Access needs to be on the machine generating the reports (e.g.
on the server when using SSW Access Reporter)
- Need an Access License
- Not designed natively for the web
- No drill-down features
- No OLAP support
-
(Windows Clients Only ) Not every end user has Access (this is a
show stopper if Access in not in the client's SOE!)
Conclusion
Only use
SSW Access Reporter
for solutions that have a big investment in Access.
AccessReporter Demo
-
-
Figure: Tools like SSW Access Reporter help to display your
Access data on the web
View a
 Sample report
-
Office Web Controls (OWC)
Pros
-
Allow you to embed interactive office documents in to HTML
- Supports updates to the datasource via the control
-
Easy to create - just save a document in "Interactive HTML
format"
- Supports pivot tables, spreadsheets, charts
Cons
-
Require a download or to have office installed (typically you
would only install on an intranet)
-
They run as an ActiveX control - so have limited access to your
local system
-
-
Figure: Office web components enable interactive charts inside
your browser, but require Office to be installed
-
OLAP - Data Analyzer (aka Microsoft's Rich Client Solution)
Pros
- A visually appealing UI.
- Full drill-down support.
-
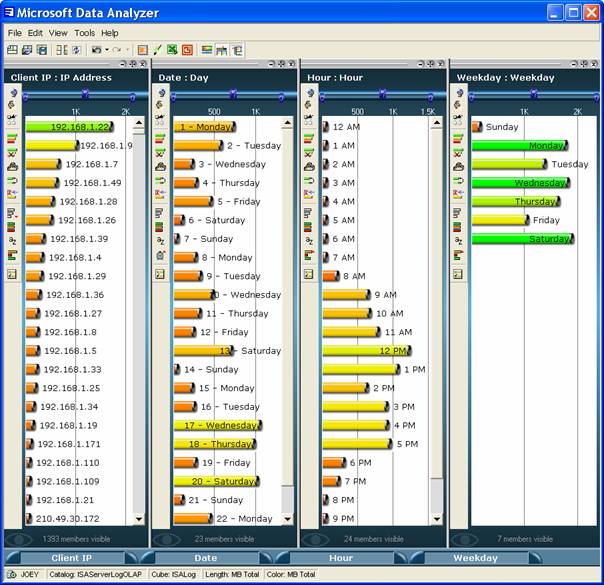
-
Figure: Office Excel 2007 delivers new powerful data
visualization tools
Cons
-
No longer supported. This functionality has been moved into
Excel 2007.
-
Microsoft dont have a web version of Data Analyzer.
-
OLAP - 3rd Party
Alternatively you can use:
http://www.thinslicer.com
(free)
http://aladdin.sdm.com.au/demo/Template/AladdinFixedReports.asp
http://www.zaptechnology.com