-
When presenting make sure you use AdventureWorks database and
OLAP cube
For years we have been using the samples of Northwind (for SQL
Server) and FoodMart (for OLAP). Well no more... SQL Reporting
Services includes a new sample database of AdventureWorks2012.
Download
AdventureWorksDW zip file
which contains the AdventureWorks2012DW database (a backup of a
flattened/de-normalised version of AdventureWorks2012) and the
AdventureWorks2012 analysis server database that includes the
Reseller Sales cube. (7.41 MB - .zip)
View
Instructions
on setting up the above resources.
-
Make a separate database for your Data Warehouse
You should always base your cubes off a separate data warehouse
database. For larger organizations this will also reside on
separate machines. This will be used as the store for all the
data collected as time rolls on. Why would you do this?
The good things:
- Only keep data you want
- Allows you to purge old data from OLTP
-
Allows you to record Time Dependant info (Slowly Changing
Dimensions)
- Performance not hitting the OLTP
The bad things:
- Redundancy Disk space
- Mirror Schema changes
People often ask: Why make a new database and not just make
Views/StoredProcs? The answer to this is that when using
multiple databases, cleaning data gets harder and messier
without the data warehouse in the middle (where a DTS package
may exist for each datasource into the warehouse).
-
-
Figure: A good naming convention for your Data Warehouse is to
tack on DW to the end of the name
An Exception:
If you are
not
worried about performance issues and your data is clean,
then you dont need to make another database
Just add the business logic using views (eg. If you have a
bit field, but you want to add meaning, then you add a
view with a CASE statement).
Note: In SQL Server 2005 you would add this business logic
in a new layer Data Source Views within the UDM (Unified
Data Model)
|
-
Do you follow a naming convention for your Data Warehouse?
Use Dim<Name> for the dimension tables. (e.g. DimAccount)
(
Tip
: think of Dimensions as your filters/WHERE/ GROUP BY)
Use Fact<Name> for the fact tables. (e.g. FactFinance)
(
Tip
: Fact tables contain the numbers/measures (or the transactions
tables/COUNT()/SUM())
-
-
Figure - Bad Example - no standard naming conventions,it is
unclear what some tables are used for
-
-
Figure - Good Example - We can clearly see which tables are
dimensions and which are facts
-
Do you have a DimTimeDay table in your Data Warehouse?
Your data warehouse must have a table DimTimeDay with a record
for every day. This way when you want to make reports based on
time (which you inevitably will), you can view data for
periods other then standard calendar periods (e.g. the fiscal
quarter).
How do you create this?
Well, there are two ways that we recommend:
-
Using the Dimension Wizard in SQL Server 2005 (see
Creating a Time Dimension in 10 Easy Steps
for more information - Preferred Method).
-
Using
BI Accelerator
 .
.
While we prefer using the Dimension Wizard in SQL Server 2005,
you may find using BI Accelerator to be more customizable;
however, you should be aware that BI Accelerator is an Excel
sheet that creates an entire data warehouse (including DB, Cubes
and DTS to populate it) and not just the Time Dimension table.
|
|
Figure: Time Dimension table after completing the
Dimension Wizard in SQL Server 2005
|
|
|
Figure: This is what your Time Dimension will look
like after using BI Accelerator.
|
-
Do you know which Performance you care about?
There is
SQL Server 2008 White Paper: Analysis Services Performance
Guide
.
Sometimes it is a trade-off like when you set lots of aggregates
which making the users querying faster, but makes the Cube
slower to build, and larger.
-
Always make the Lowest Level of a Dimension the Key
You should always have a unique key for every element of data.
This means that the lowest level of a given dimension should be
the key as this will be unique and based on some unique key
already.
For example:
|
|
Figure: What is wrong with this? ...
|
|
|
Figure: ... Well the bottom Level (called the Leaf
Level) should always be the key.
|
Note: Remember to make the
Member Keys Unique
= True and
Member Names Unique
= True
The first reason is for performance as in the Cube Editor you
can successfully run Tools Optimize Schema.
Note: This improves Cube Building Performance (always) and
Querying Performance (for some cases).
The second reason is a smaller cube size, but you need to apply
the next rule for that..
-
Always use Virtual Dimensions instead of Real Dimensions where
possible
|
|
Figure: What is wrong with this? ...
|
Well we are using Real Dimensions for "Product Color" and
"Product Size", when they should be Virtual Dimensions of the
Product Dimension
There are 3 steps to doing that:
1) Add the
Member Properties
eg. Color and Size
2) Delete the original Shared Dimension
3) Add the new Virtual Dimension using the wizard
Note: This improves Cube Building Performance (always) and
Querying Performance (for most cases as the cube is physically
smaller).
-
When you are using Real Dimensions, when applicable specify the
"Depends On Dimension" property
A common property which is often overlooked is "Depends on
Dimension". This will indicate to the aggregate engine that
these dimensions are related, therefore more efficient
aggregates will be built.
-
-
Figure: In this example the Depends on Dimension property
should be set to "Product"
Note: This improves Cube Building Performance (sometimes) and
Querying Performance (for most cases because you have more
efficient aggregates in the Cube).
-
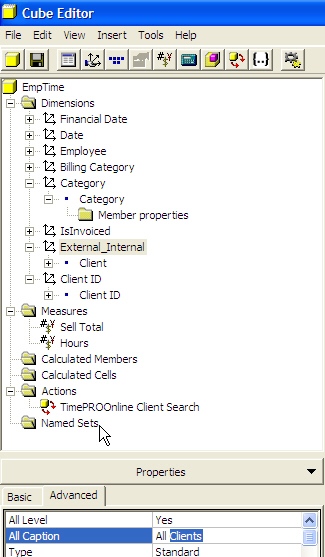
BI - Always make sure the dimensions All Captions = All -
*FIXED IN SQL 2008*
When you are carrying out reporting (using Reporting Services)
based on some OLAP cube you should change the "All Caption"
property of each dimension to be have the value "All". By
default the caption for the dimension will be "All
<dimension_name>" (e.g. All Products). This default is
distracting when used in reporting solutions and doesn't
particularly clarify anything anyway.
-
-
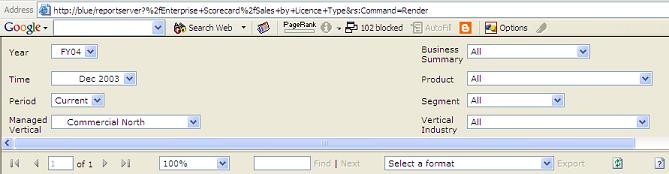
Figure: Set the "All Caption" to read "All" instead of the
distracting default
When you use this dimension in the parameter toolbar of
Reporting Services this default value will look horrible and it
should be changed to some consistent value in order to
facilitate fast scanning of the parameter values.
-
-
Figure: Having set the All caption nicely, you can more easily
see which products aren't using the defaults.
Read our rule on
Controls - Do you include '-All-' option in your ComboBoxes?
-
Do you always use Shared Dimensions?
When you're building an Analysis Server Database you should make
always use Shared Dimensions. This is because:
-
all of your cubes can re-use them, making future cubes faster
to develop
- they are only processed once
-
-
Figure: This is the only place you should be creating
dimensions. Stay aware from Private dimensions hidden in the
cube.
-
Do you always use spaces in names?
Always use spaces for Dimension Names, Level Names and Measures
this is a business tool and you want users to see friendly
names.
-
Always make time scales clear, if using "financial year" then
make it obvious
|
2004
...
- Month 06
2005
- Month 07
- Month 08
- Month 09
- Month 10
|
|
Figure: What is wrong with this?
|
3 things:
-
If you are at the year level, the user doesnt know if it is
financial or calendar
-
When you are at the month level, the user doesnt know what
year they are in
-
The full month names should be used because there are no
issues with sorting.
When you create the dimension you specify the Order By to be
Key. Therefore it would look like this:
|
FY 2004
- Jun 2004
FY 2005
- Jul 2004
- Aug 2004
- Sep 2004
- Oct 2004
|
|
Figure: This is the type of data we want. Make names
clear and clarify that you are referring to financial
year.
|
-
Move your OLAP MetaData from Access to SQL Server
Analysis Server will by default use an Access database to store
the meta data for each of the databases. Presumably this is
because you don't necessarily need to have SQL Server on the
same machine as Analysis Server. You should change this
repository to point to your SQL Server because it's a more
secure, robust, and allows you to backup your data with your
normal SQL Server backups.
To migrate the repository of meta data:
-
In Enterprise Manager, create a new database to use for the
meta data. Call it "OLAPMetaData".
-
In Analysis Manager, right click the server, select "Migrate
Repository" and point it to your table in the database.
|
|
Figure: Move the MetaData repository away from the
default Access Database into SQL Server
|
At the end you can also double check that it worked successfully
by checking the Repository Connection String in the context menu
shown above.
-
When designing don't compute cube aggregations
When prompted about whether to process the aggregations for the
cube when you are designing, you should click No in order to
save time. However, when deploying or testing query performance
you should click Yes.
-
-
Figure: Click No while designing, click Yes when deploying or
testing performance.
-
Do you hide zero values when you are doing financial report?
Financial report could be very complicated and there are large
number of figures showing, we only want to focus on the
significant figures. Zeros could be ignored, so we will hide
zeros in order to make other figures standard out.
-
-
Figure: Bad Example - a lot of zeros are showing in the gird,
we cannot see the significant figures.
-
-
Figure: Good Example - zeros are hidden, easy to focus on the
values
To do this in Excel sheet, you can simply choose the cell and
format it as "Accounting"
-
- Figure: Excel - choose "Accounting" as the cell format
-
Do you remove decimal places from chart?
Graphs or charts are used for showing big picture or trend of
data. Decimal places in such reports are not useful at all, only
a waste of space. So you should always remove decimal places
from charts.
-
-
Figure: Bad Example - decimal places on a chart is a waste of
space
-
-
Figure: Good Example - decimal places are removed from the
chart
-
Do you use conditional formatting to visualize your data?
If you are using Excel 2007, there is a very exciting new
feature that allows you to visualize your data in the place. It
allows you to view your data in a visual way, make it very easy
to tell the difference.
-
-
Figure: Bad Example - no visualization, cannot tell the
difference of data easily
-
-
Figure: Good Example - visualized data, very easy to read and
understand the difference
You can simply choose "Conditional Formatting" from the tool bar
in Excel 2007 to do this.
-
-
Figure: Choose "Conditional formatting - Data Bars" to enable
data visualization
-
Can you use the super cool Microsoft Data Mining Addin?
Microsoft SQL Server 2005 Data Mining Add-ins for Microsoft
Office 2007 (Data Mining Add-ins) allow you take advantage of
SQL Server 2005 predictive analytics in Office Excel 2007 and
Office Visio 2007.
-
-
Figure: Simply click the highlight exceptions to see data that
looks abnormal
-
- Figure: Click Forecast on this one
-
Do you avoid defaulting data?
In Business Intellegence, it is not preferable to default data,
eg. Country=USA, There are so many web pages that do this and it
it influences data - and ruins your Business Intelligence
reports - you think they are all from the USA - when really they
have just left the default.
Check rule
Do you avoid "Data Junk"?
in Rules to Better Interfaces.
-
Do you always sort dates in Excel in descending order from right
to the left?
When you're working with spreadsheets in Excel, be sure to sort
dates in descending order from right to left.
-
-
Figure: Bad Example - Dates are sorted from left to right.
-
-
Figure: Good Example - Dates are sorted from right to left.
-
Do you check the cube has been processed?
You'd better check the cube has been processed.
-
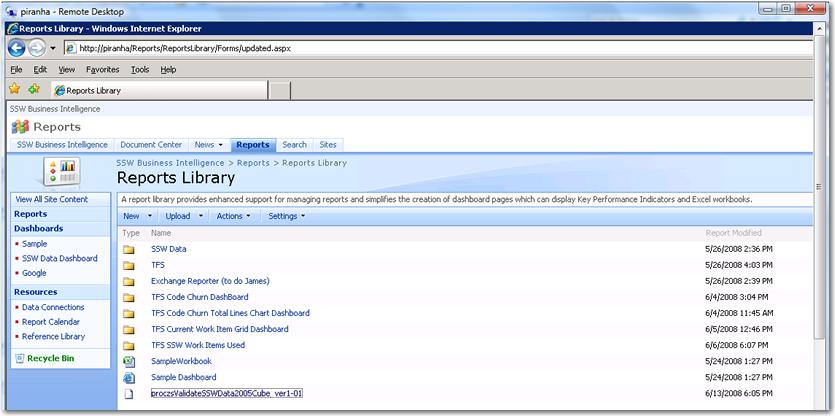
- Figure: proczsValidateSSWData2005Cube_ver.1-01.
-
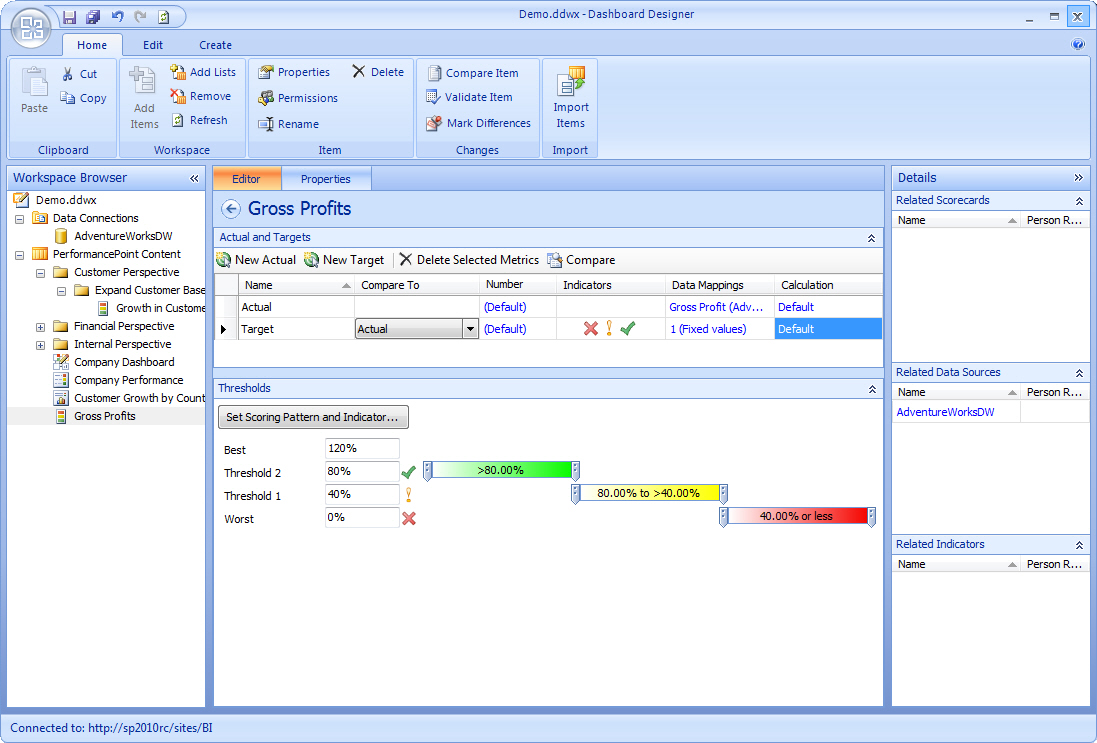
Do you know where to put your KPIs? (Cube or PerformancePoint
Server)
PerformancePoint Services 2012 gives you a nice GUI to build
KPIs if you are not familiar with MDX. The bad news is that
these KPIs can't be used by any other cube browsers (e.g. Excel)
So the question is... Do you put the KPI in the cube (and link
it in PerformancePoint Services 2012) or directly into
PerformancePoint Services 2012?
-
-
Figure: Bad Example - PerformancePoint Services - Dashboard
Designer - Creating a KPI - Very easy to use
The cube gives you the flexibility to write whatever KPIs you
want (including trends) ?but you need to know MDX
-
-
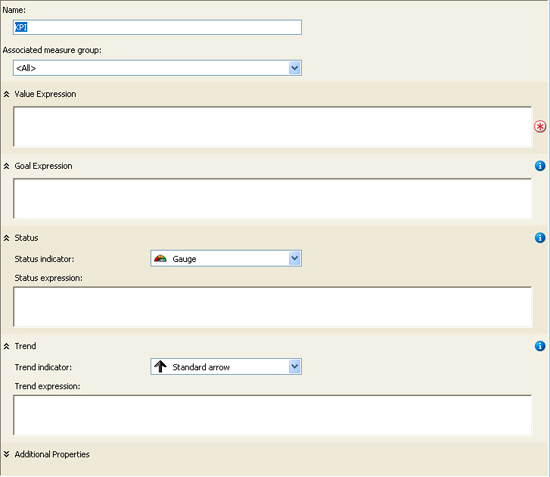
Figure: Good Example - BIDS - Creating a KPI with MDX
statements - ultimate flexibility,steep learning curve
Ultimately, having the KPIs in the cube makes more sense.
Keeping them centralized, link them in PerformancePoint Services
and potentially allow other cube browsers (like Excel) to access
them
- Figure: The reason to put your KPIs in the cube
-
Do you build a layer of views in the data warehouse that has the
business rules and calculations?
Having the cube work from views is the first step in ensuring
the stability of the cube. As the cube matures and the business
refines what it needs to report on, the cube will change and
have facts and dimensions added or removed from it.
By using views developers can hide the change in schemas and
always present a consistent interface for the cube to work with.
For example, you can put the calculation of the GST component as
a calculated field in a view. However, our preference is to
create a denormalized field to store this data. (See our rule
Do you use triggers for denormalized fields?
)
-
Do you use logging in your ETL and SSIS packages?
The data warehouse is the one source of truth (see
Do you fix data integrity problems before it gets to the data
warehouse?
), so to prevent bad data from getting in there we can log them
using SSIS.
You can log any exceptions to a table (see
http://msdn.microsoft.com/en-us/library/ms140246.aspx
. This way you can either allow good data to still be processed
and just filter out the bad data.
You can then report on, and have metrics on the errors.
This will help improve the quality of the data in the warehouse
as the cube matures.
-
Do you fix data integrity problems before it gets to the data
warehouse?
The data warehouse is the one source of truth. Data should have
integrity and be verified to exist in the warehouse.
Your first line of defence is verifying the data in your source
databases are correct. This can be achieved using a procValidate
to check the data. See our rule Do you validate each
"Denormalized Field" with procValidate?
You next line of defence is in the ETL process where you can
check for data integrity issues (e.g. missing keys, values). At
this point you can choose to fail the process or proceed with
the valid records (logging the invalid ones). See our rule
Do you use logging in your ETL and SSIS packages?
The last thing you can do, and at this point the data is in the
cube already, is to hide these errors with "unknown members".
-
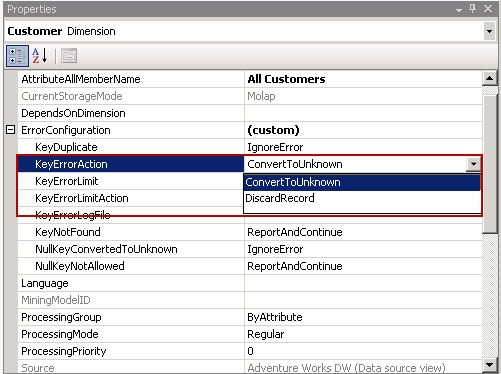
-
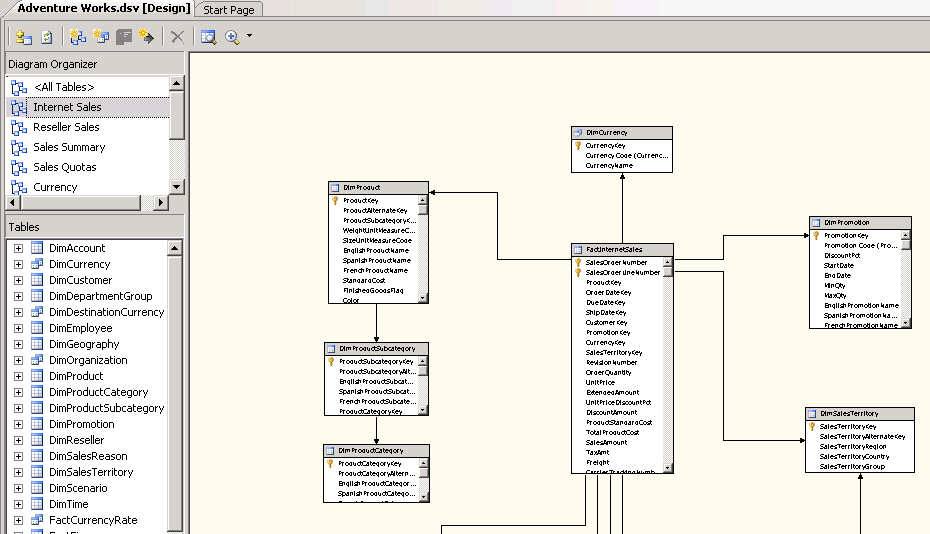
Do you add a diagram for each fact table
Adding a diagram helps users clearly see which dimensions are
related to which fact tables.
-
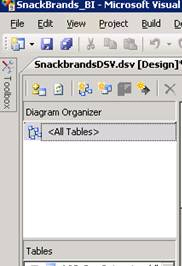
-
Figure: Bad Example - There are no diagrams at all to help the
user see how facts are related to dimensions
-

-
Figure: Good Example - There is a diagram for each fact table