Do you cache headless CMS content to stay inside your API quota?
Loading last updated info...
A headless CMS like Contentful bills by the API call. If your site fetches content from the CMS on every request, every page view costs calls. So does every bot, every crawler and every 404. The bill grows with traffic, not with how often the content changes.
It is also silent. Nothing breaks and the pages still load. Nobody opens the usage page until an invoice or a throttling error turns up.
Know what your plan allows
Find your plan's API call quota, and what happens when you go over it. Contentful's usage limits show the three shapes this takes:
- Free - a fixed monthly quota, with no overage allowed
- Lite - a monthly quota, then every extra million calls is billed, with no cap
- Premium and Enterprise - no per-call billing, but every request is bound by the technical limits, so heavy uncached traffic risks being throttled
Whichever plan you are on, uncached traffic ends up as either a bill or throttled requests.
Measure calls per page view
Monthly API calls are roughly page views multiplied by calls per page view. Most teams know the first number and have never measured the second.
A CMS-driven page usually makes more calls than you expect. There is the page itself, then the navigation, the footer, global settings, related items and any listing on the page. The layout calls happen on every page, including 404s, and a sitemap can fan out into hundreds.
To measure it:
- Log every outgoing CMS request in a local build, for example with HTTP client middleware that appends each URL to a file
- Request a key page once, and count the lines
- Request the same page again, and count again
The second count is what a real visitor costs once your caches are warm. If it matches the first, you have no cache.
Keep counting in production
A local count proves the cache works on your machine. Production has real traffic, bots and cold starts, so keep the count running there too.
Count at the HTTP client, because that is the one place that sees every call, whichever SDK or cache made it. Record the calls that reached the CMS separately from the ones the cache answered, and attach both as numbers to each request's telemetry. Because every request carries its route, you can then average the calls per page, find the most expensive page, and see whether a release changed it. See Do you know how to set up Application Insights? and Do you know how to analyse your web application usage with Application Insights? for custom metrics.
Where your monitoring already records outgoing HTTP calls as dependencies, counting CMS calls per request is a query rather than new code. Check which HTTP clients Application Insights collects automatically for your stack before writing a counter.
Check the daily total against the CMS usage page, because that is what you are billed on. If the two do not match, something is calling the CMS outside a page request, such as a background job, a scheduled task or a sitemap build, or your telemetry is being sampled.
Cache in layers
- Serve whole pages from a cache. Static generation, incremental regeneration, output caching or a CDN in front of the site all work. A repeat view served this way makes no CMS calls at all. See Do you choose the right rendering strategy for your website?, and for Next.js, Do you know how to use NextJS caching system?
- Cache shared content in the app. Navigation, footer and site settings appear on every page. Fetch them once and reuse them from a cache that survives between requests and across servers, such as Redis. See Do you choose the right cache store?
- Clear the cache when content is published. Use Contentful webhooks to clear the pages that changed. A short expiry that refetches "just in case" spends calls on content that has not changed
Prove the cache is being read
The most expensive cache is one that looks like it works. The code writes to the cache and the config looks right, but every read misses. These are the common causes, and none of them throws an error:
- The page cache is set up for one web server (e.g. Apache
.htaccessrules) but production runs another (e.g. nginx), so cached pages are written and never served - A cache read helper never returns the value it found
- Caching sits behind a config flag that defaults to off and is never set in production, like Sitefinity's debug="true"
- Code reads a value from the cache, then fetches it fresh anyway on the next line
- The cache driver is in-memory, so it forgets everything at the end of each request
The only way to find these is to count calls. The second view of a page should cost far fewer calls than the first, and a page served from a page cache should cost none.
On the example site at the end of this rule, Application Insights showed the difference:

❌ Figure: Bad example - Production telemetry with the content cache off. Every call still goes to the CMS

✅ Figure: Good example - The same site with the content cache on. Most calls are answered by the cache, which proves it is being read
Search is billed the same way
Hosted search services like Algolia bill per search request. If a listing page runs a search on the server every time it renders, it has the same problem, and bots paging through every filter and page number multiply it. Cache search results the same way. Use robots.txt to keep crawlers out of the filter and paging combinations, while leaving the articles themselves crawlable.
Watch the usage page
Check the CMS usage page as often as you check the cloud bill, and always after a release that changes how content is fetched. Better still, count calls per page on the PR before it merges, as part of comparing PR performance with production. Turn on usage alerts where the CMS offers them. If usage is heading past the quota, tell the client before the invoice does, the same way you would warn about a spike in Azure costs.
Example: a site 10 times over its quota
A marketing site on Contentful's Lite plan had a quota of 3 million API calls a month. From November to July it used between 18.7 and 30.7 million a month. Nearly every call came from the Content Delivery API, which means the website itself, not the editors.
Measuring locally showed 20 to 40 calls per page view. A 404 page cost 20. A repeat view cost exactly the same as the first. The site had a page cache, an app content cache and an SDK cache, and each one was broken by a cause on the list above. Every one of those calls was also a round trip the server made before it could send the page, so the site was slow as well as expensive.
Fixing the cache read and the navigation refetch took a warm homepage from 23 calls to 10, and a warm content page to 7. Serving the page cache from nginx means repeat views of cached pages never reach the app at all, so they cost nothing.
The page cache went live in production on 31 August. Monthly calls fell from 30.7 million in June to 5.1 million in September. That is still above the 3 million quota, but it is a sixth of the peak.
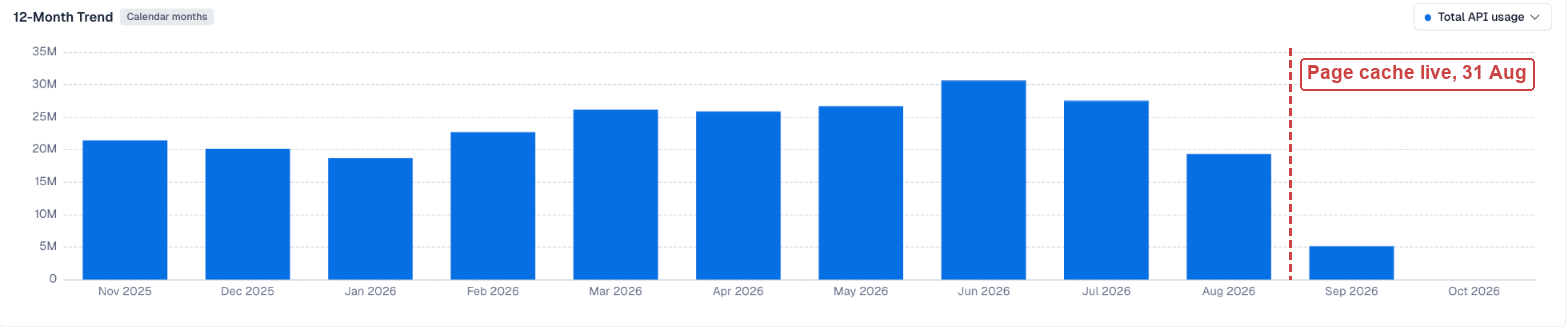
Figure: Monthly API calls from the CMS usage page. The first full month after the page cache went live is a sixth of the June peak