Do you check your dashboard totals against the source?
Loading last updated info...
When teams use AI to write dashboard queries, a plausible total can hide missing or duplicated records. Northwind Traders' example spend dashboard shows September AI costs of $6,907.40 against an invoice of $6,335.71. It also names product descriptions as the largest cost and recommends a cheaper model. The total and the feature ranking are both wrong.
Reconcile dashboard totals against an independent source before acting on the insights. A plausible total is not evidence that the query counted the right records.
These Northwind dashboards use example data.
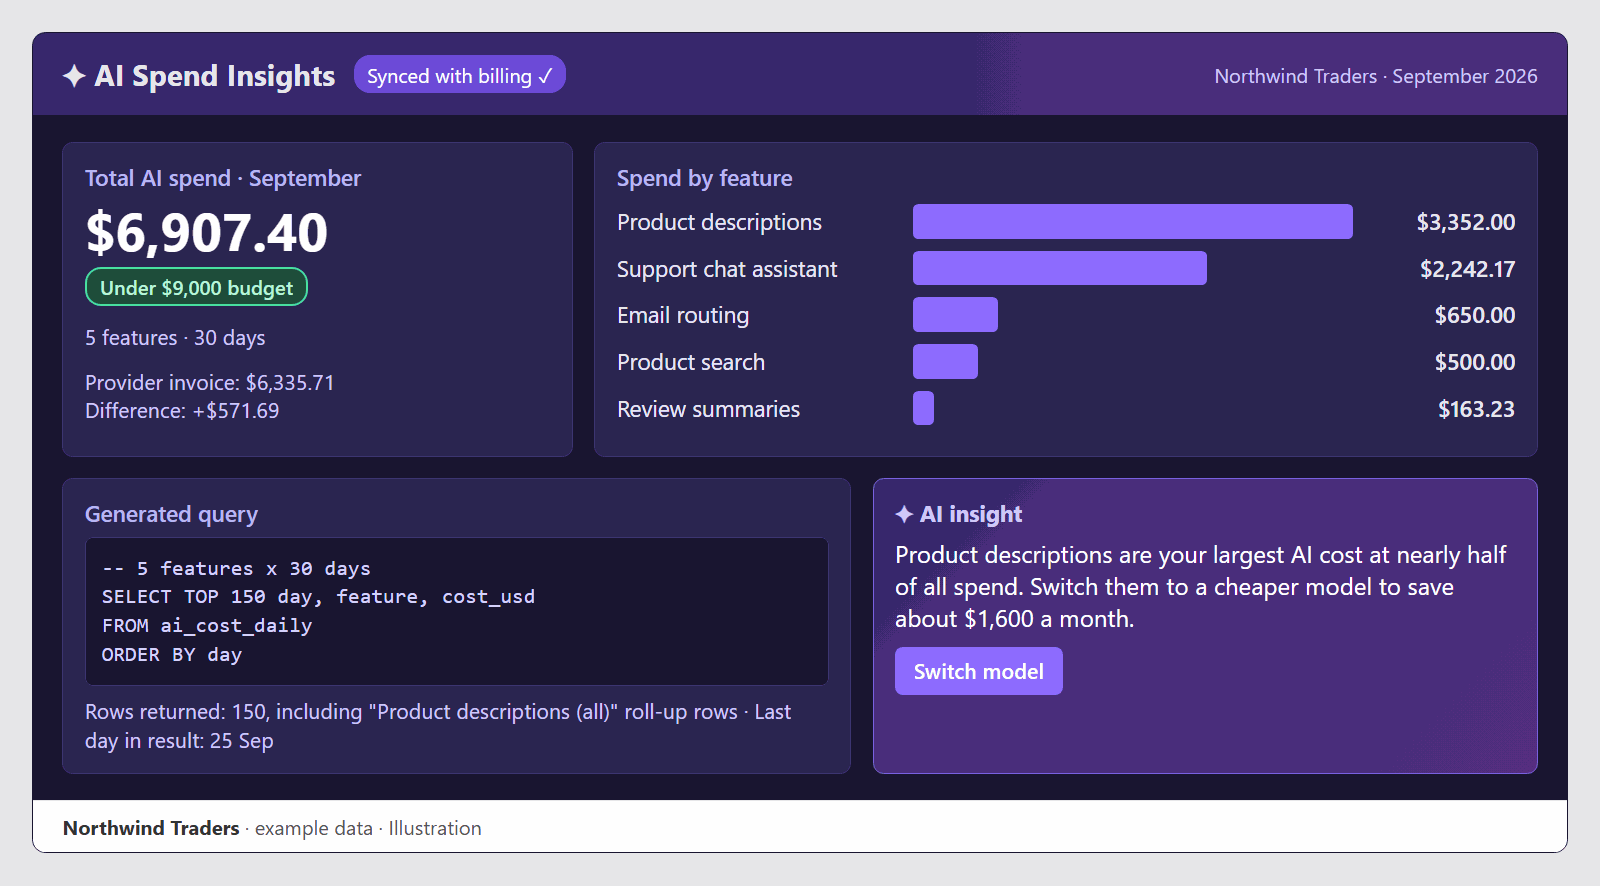
❌ Figure: Bad example - The query drops five days and double-counts roll-ups, leaving spend $571.69 above the invoice
Compare the same closed window
Start with a closed billing period. Match the account, currency, time zone, taxes, credits and cost basis before comparing. A calendar-month usage estimate need not equal an invoice issued on a different billing cycle. Azure explains how cost data is processed and closed.
Compare against the invoice or an independently produced report, not another tile that reuses the same query. Check feature subtotals too: moving cost between features can leave the total correct and the ranking wrong. Keep unattributed costs visible.
Northwind also has a token-based estimate of $5,964.22. Keep it separate from billed spend. It sums recorded token counts multiplied by the applicable list price for each model and token type. Negotiated rates, pricing tiers and rounding can make the bill differ from that estimate. The invoice is about 1.06 times the estimate; track this ratio over comparable closed periods to spot pricing or attribution drift, then investigate a change. The ratio does not explain the difference, and the estimate is never an extra charge.
Read every row and count each cost once
In this example, the AI coding assistant assumes five features × 30 days and writes SELECT TOP 150, ordered by day. The source contains 180 rows because one feature has both daily detail and parent roll-ups. The query drops the last five days and adds some costs twice; the errors partly cancel.
Read every API or export page, compare rows read with rows available, and flag a query that reaches its limit. Aggregate either detail rows or their summaries, never both. Northwind replaces the faulty summary-table query with a saved metric query that reads the provider billing export directly: 11,482 of 11,482 charge records across three pages. These raw billing records are a different source from the 180 daily summary rows.
Save the reconciliation with the metric
Keep the saved metric query billing_spend_v1 and its reconciliation checks in source control. Run them on every refresh and display the difference before generating advice. Where exact equality is inappropriate, document the rounding tolerance and explain any remaining difference. A failed check makes the figure Unreconciled, not ready for an AI recommendation. Assign the metric owner to investigate the difference and verify the check before clearing that status. Data assertions can automate these checks.
Reconcile the useful-outcome denominators too. Northwind checks 2,804 resolved chats against the helpdesk report and 9,388 routed emails against the inbox log.
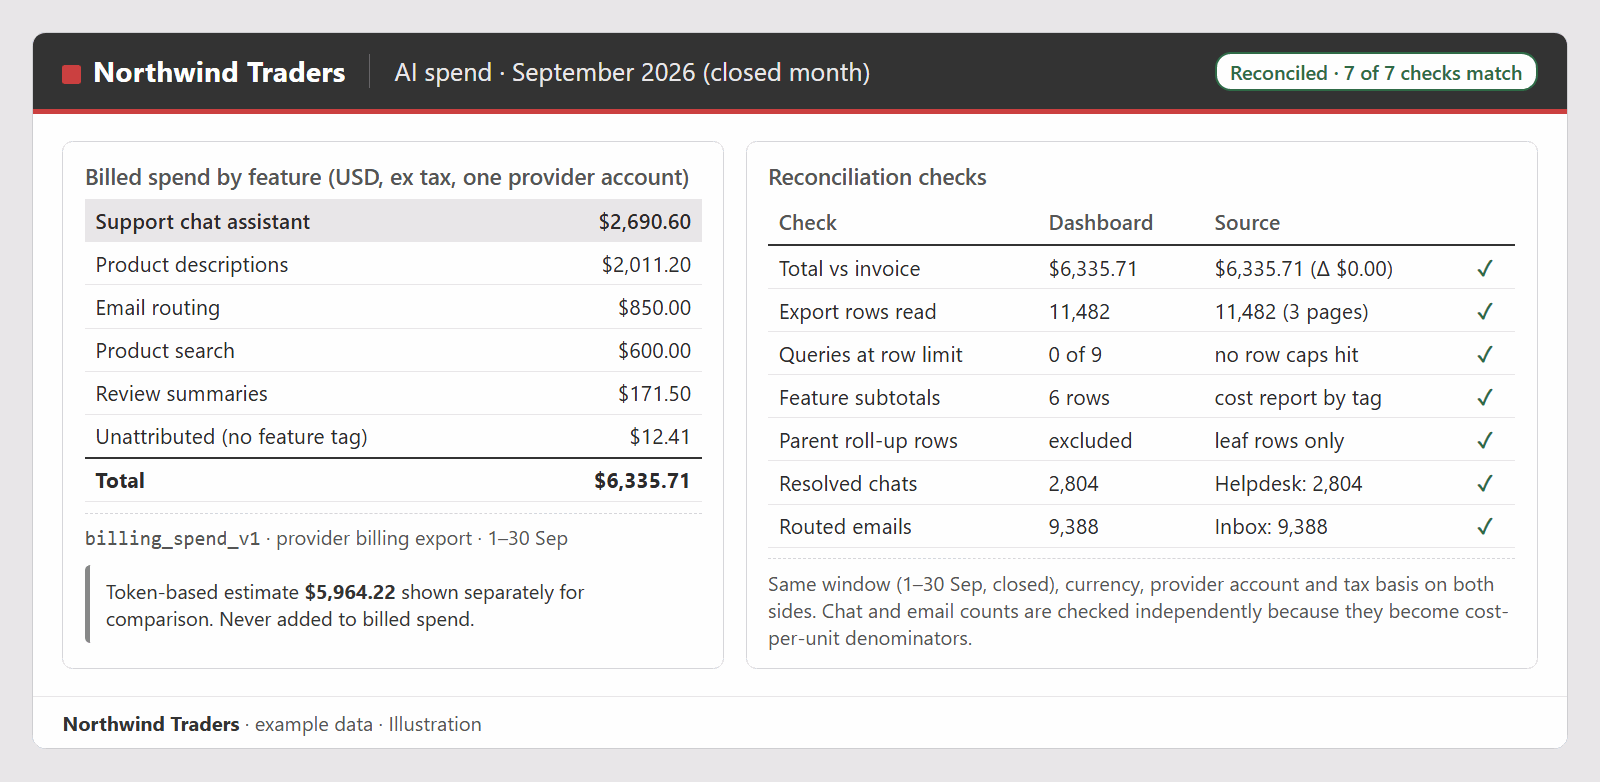
✅ Figure: Good example - The $0.00 difference is supported by complete rows, independent subtotals and checked outcome counts
Building traceable dashboard tiles gets figures onto the page. This independent check establishes whether they agree with the source of record.