Do you reduce your Azure costs?
Loading last updated info...
Dealing with questions from Product Owners about expenses related to applications hosted on Azure can be a real headache 🥲
Get ready to empower your Product Owners! When it comes to Azure expenses, you want to be informed and monitor your costs. You can also have a solution that not only helps you understand where the spending is coming from, but also helps you find ways to optimize it. With Azure Cost Analysis, you can confidently provide your Product Owners with insights and recommendations that will save time and money, and make everyone's day a little brighter ✨
Always tackle the biggest 3 costs first. In most instances they will be upwards of 98% of your spend, particularly if you are in a wasteful environment. I have seen MANY projects where the largest cost by a significant margin was Application Insights. - Bryden Oliver, Azure expert
youtube: whXWijQCQTU
Video: Managing your Azure Costs | Bryden Oliver | SSW Rules (5 min)
Azure Cost Analysis gives you a detailed breakdown of where any Azure spending is coming from. It breaks down your cost by:
- Scoped Area e.g. a subscription
- Resource Group e.g. Northwind.Website
- Location e.g. Australia East
- Service type e.g. Azure App Service
Note: You can also 'filter by' any of these things to give you a narrowed down view.
Analysing the expenditure - Finding the big dogs 🐶
To optimize spending, analyze major costs in each category. Generally, it's a good idea to focus on the top 3 contributors - optimizing beyond that is usually not worth the effort.
Key questions to ask:
- Do you need that resource?
- Can you scale down?
- Can you refactor your application to consume less?
- Can you change the type of service or consumption model?
Scoped Area
The cumulative costs of a selected area over a given time period e.g. the cost of a subscription charted over the last year showing the period of higher or sudden growth during that time.
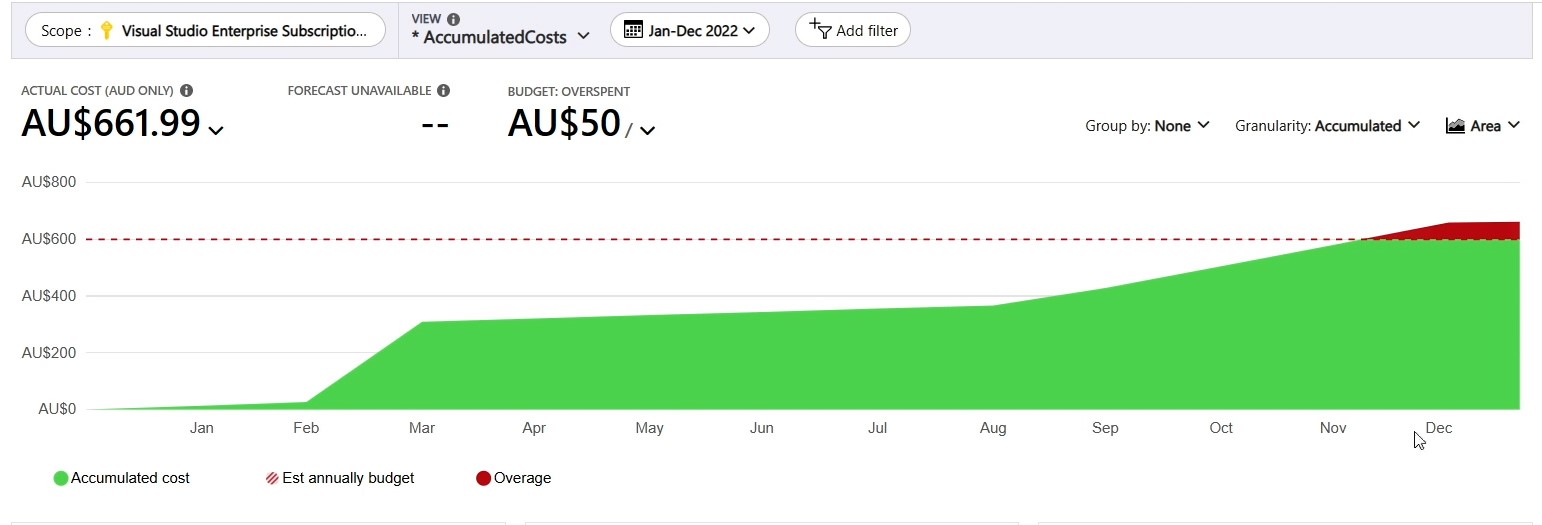
Figure: Azure Portal | Cost Analysis | Scoped Area Chart e.g. in February it was deployed and in August a marketing campaign caused more traffic
Resource Group
The cost of each resource group in the scoped area e.g the cost of the Northwind website infrastructure.
Look at the most expensive resource group and try to reduce it. Ignore the tiny ones.
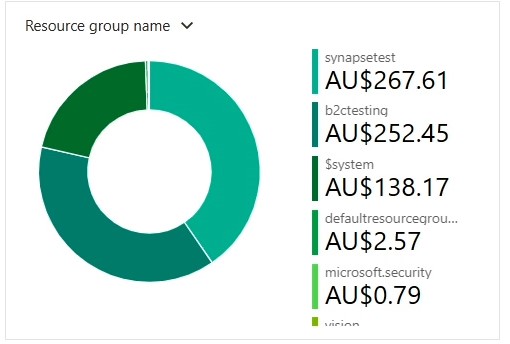
Figure: Azure Portal | Cost Analysis | Resource Group Breakdown
Location
The cost of each location e.g. Australia East.
If you have your applications spread across multiple locations, this chart can help figure out if one of those locations is costing more than others. Consider scaling each location to the scale of usage in that location ⚖️.
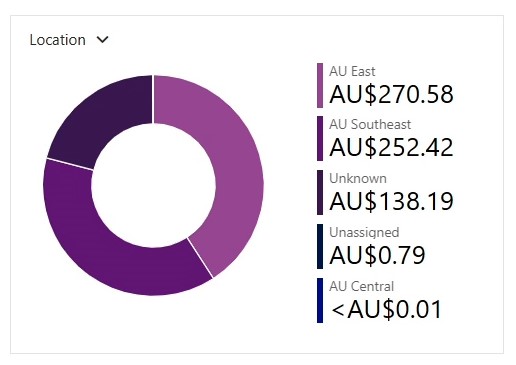
Figure: Azure Portal | Cost Analysis | Location breakdown
Service type
The cost of each service used e.g. Azure App Service.
If a specific service is costing a lot of money, consider if there is a service that might be better suited, or if that service can have its consumption model adapted to better fit the usage levels.
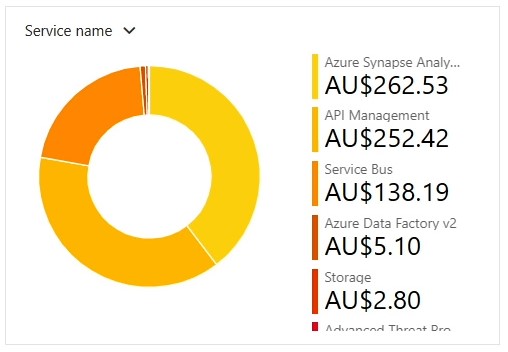
Figure: Azure Portal | Cost Analysis | Service type breakdown
What if you suspect a specific resource is a problem?
The Azure Cost Analysis tool also allows for different views to be selected. If you think a specific resource is causing a problem, then select the "CostByResource" view and then you can view each aspect of a resource which is costing money. That way you can identify an area which can be improved 🎯.
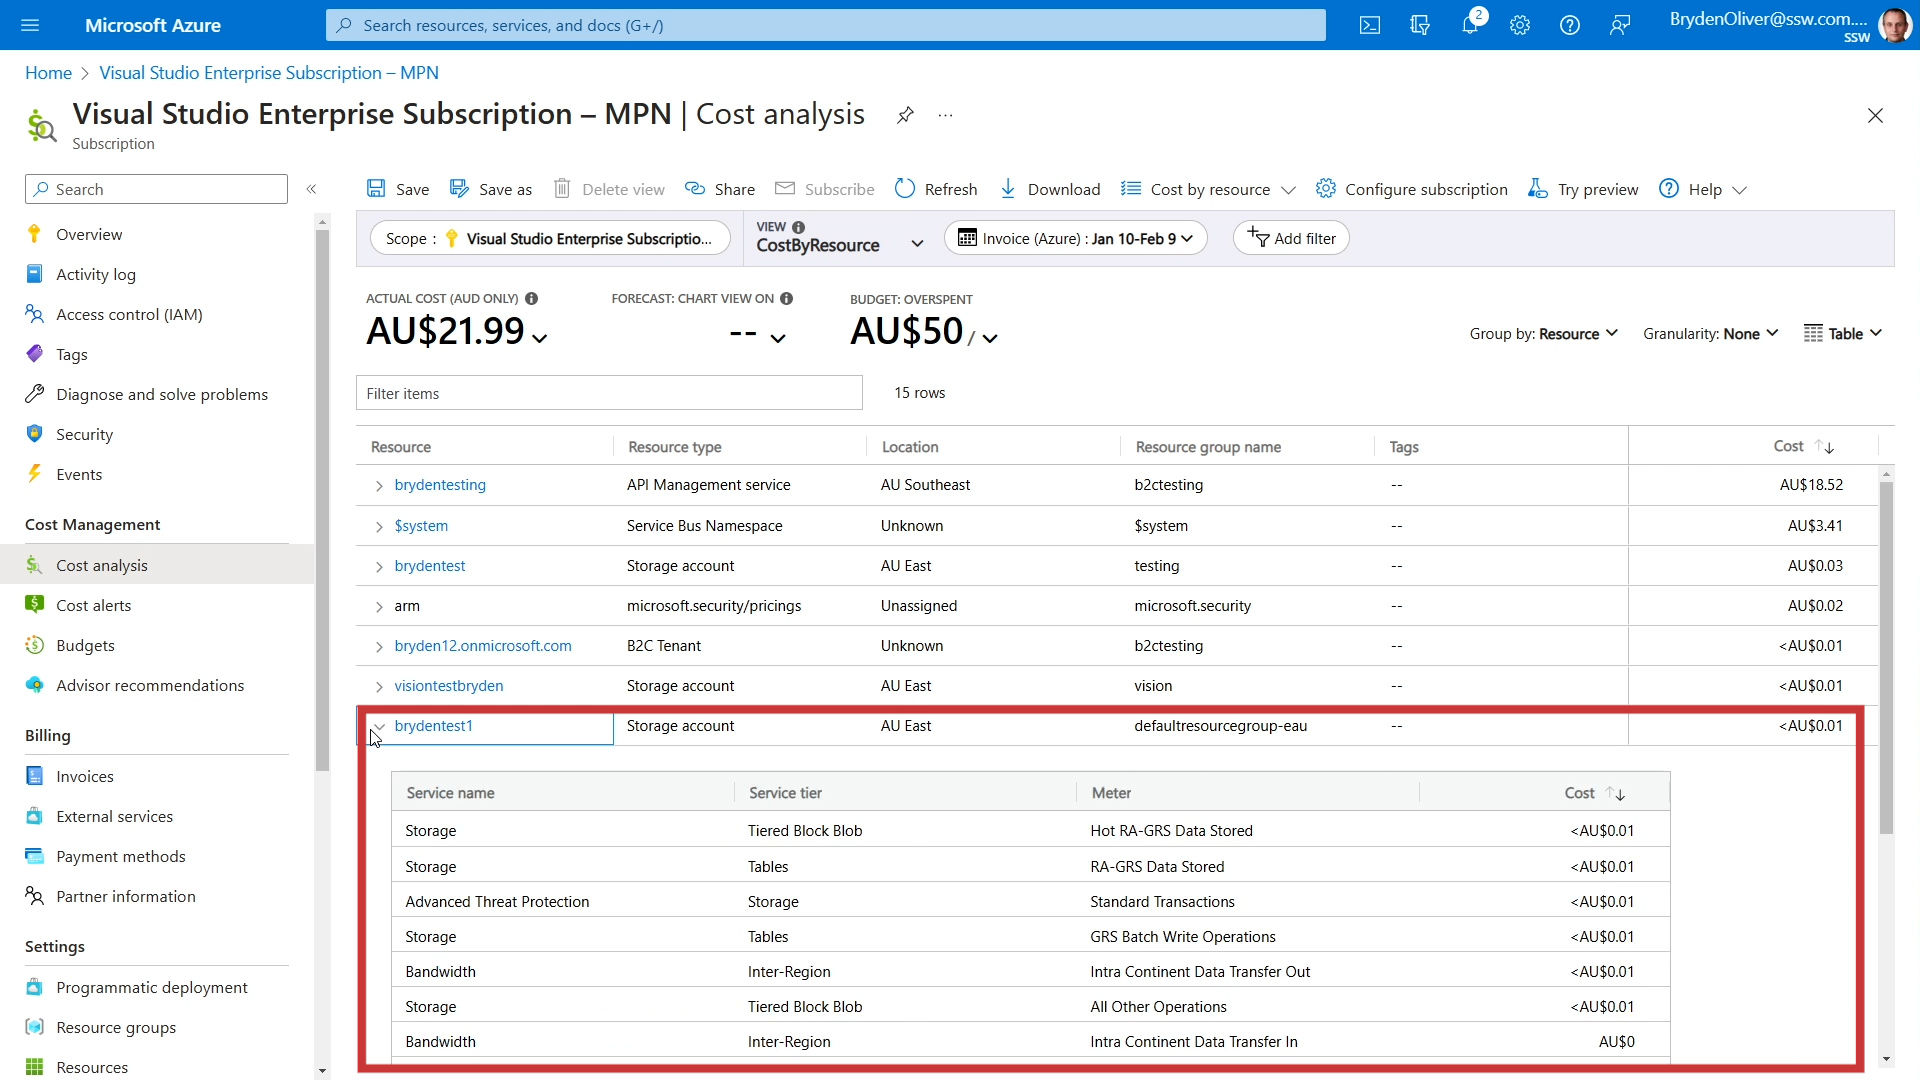
Figure: Azure Portal | Cost Analysis | View | CostByResource | Resource breakdown